Copyright
©2009 The WJG Press and Baishideng.
World J Gastroenterol. Nov 28, 2009; 15(44): 5533-5540
Published online Nov 28, 2009. doi: 10.3748/wjg.15.5533
Published online Nov 28, 2009. doi: 10.3748/wjg.15.5533
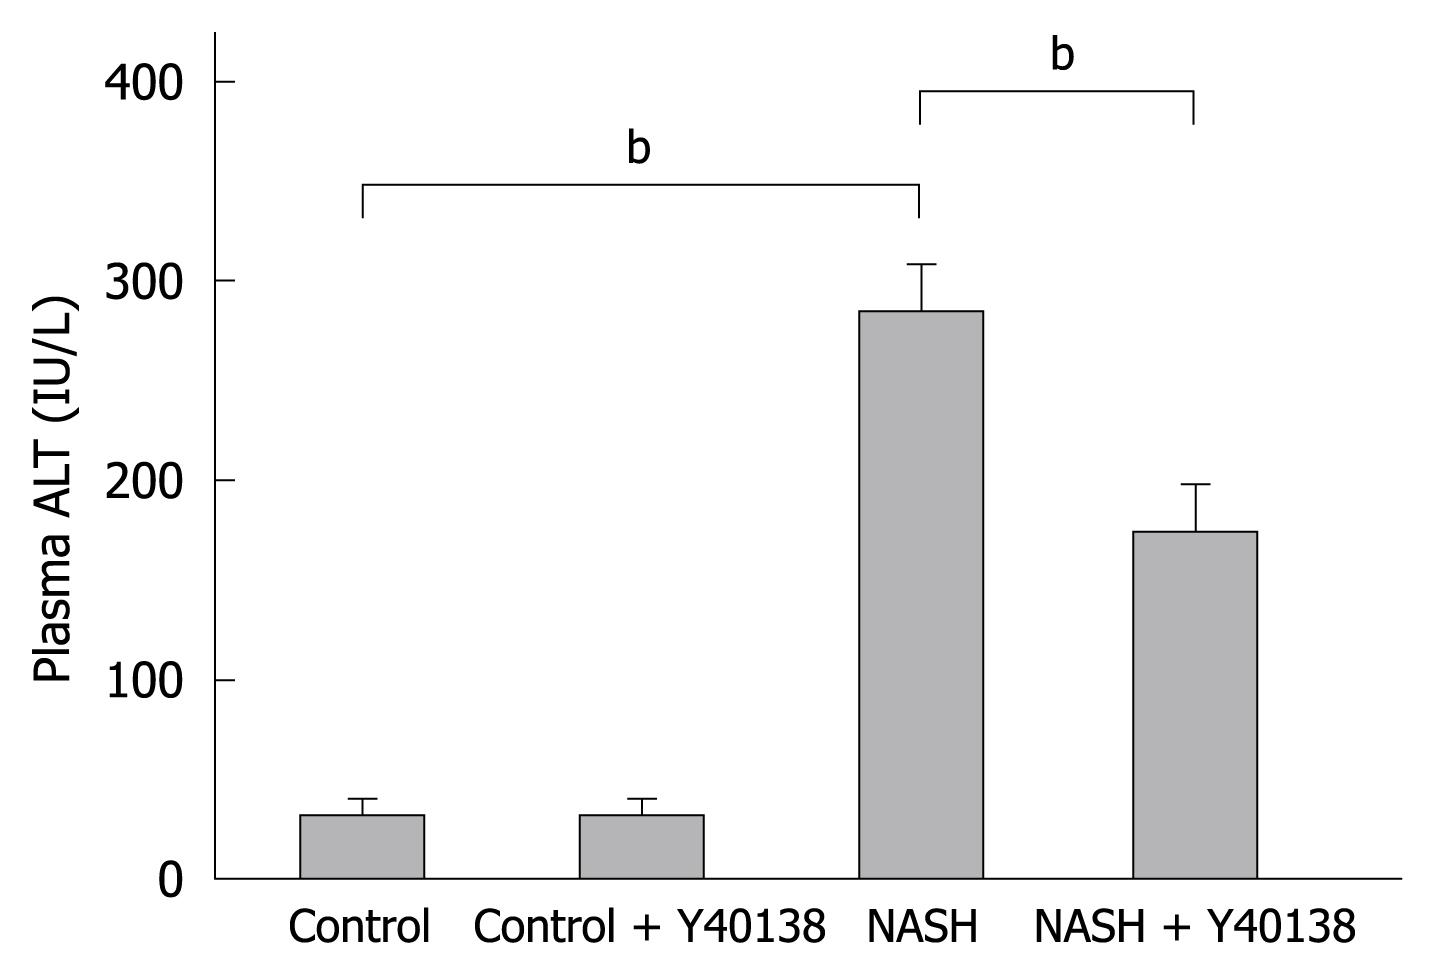
Figure 1 The plasma alanine aminotransferase (ALT) levels in the nonalcoholic steatohepatitis (NASH) group were significantly elevated in comparison to the control group.
The plasma ALT levels in the NASH + Y-40138 group were significantly decreased in comparison to the NASH group (each group n = 5). bP < 0.01.
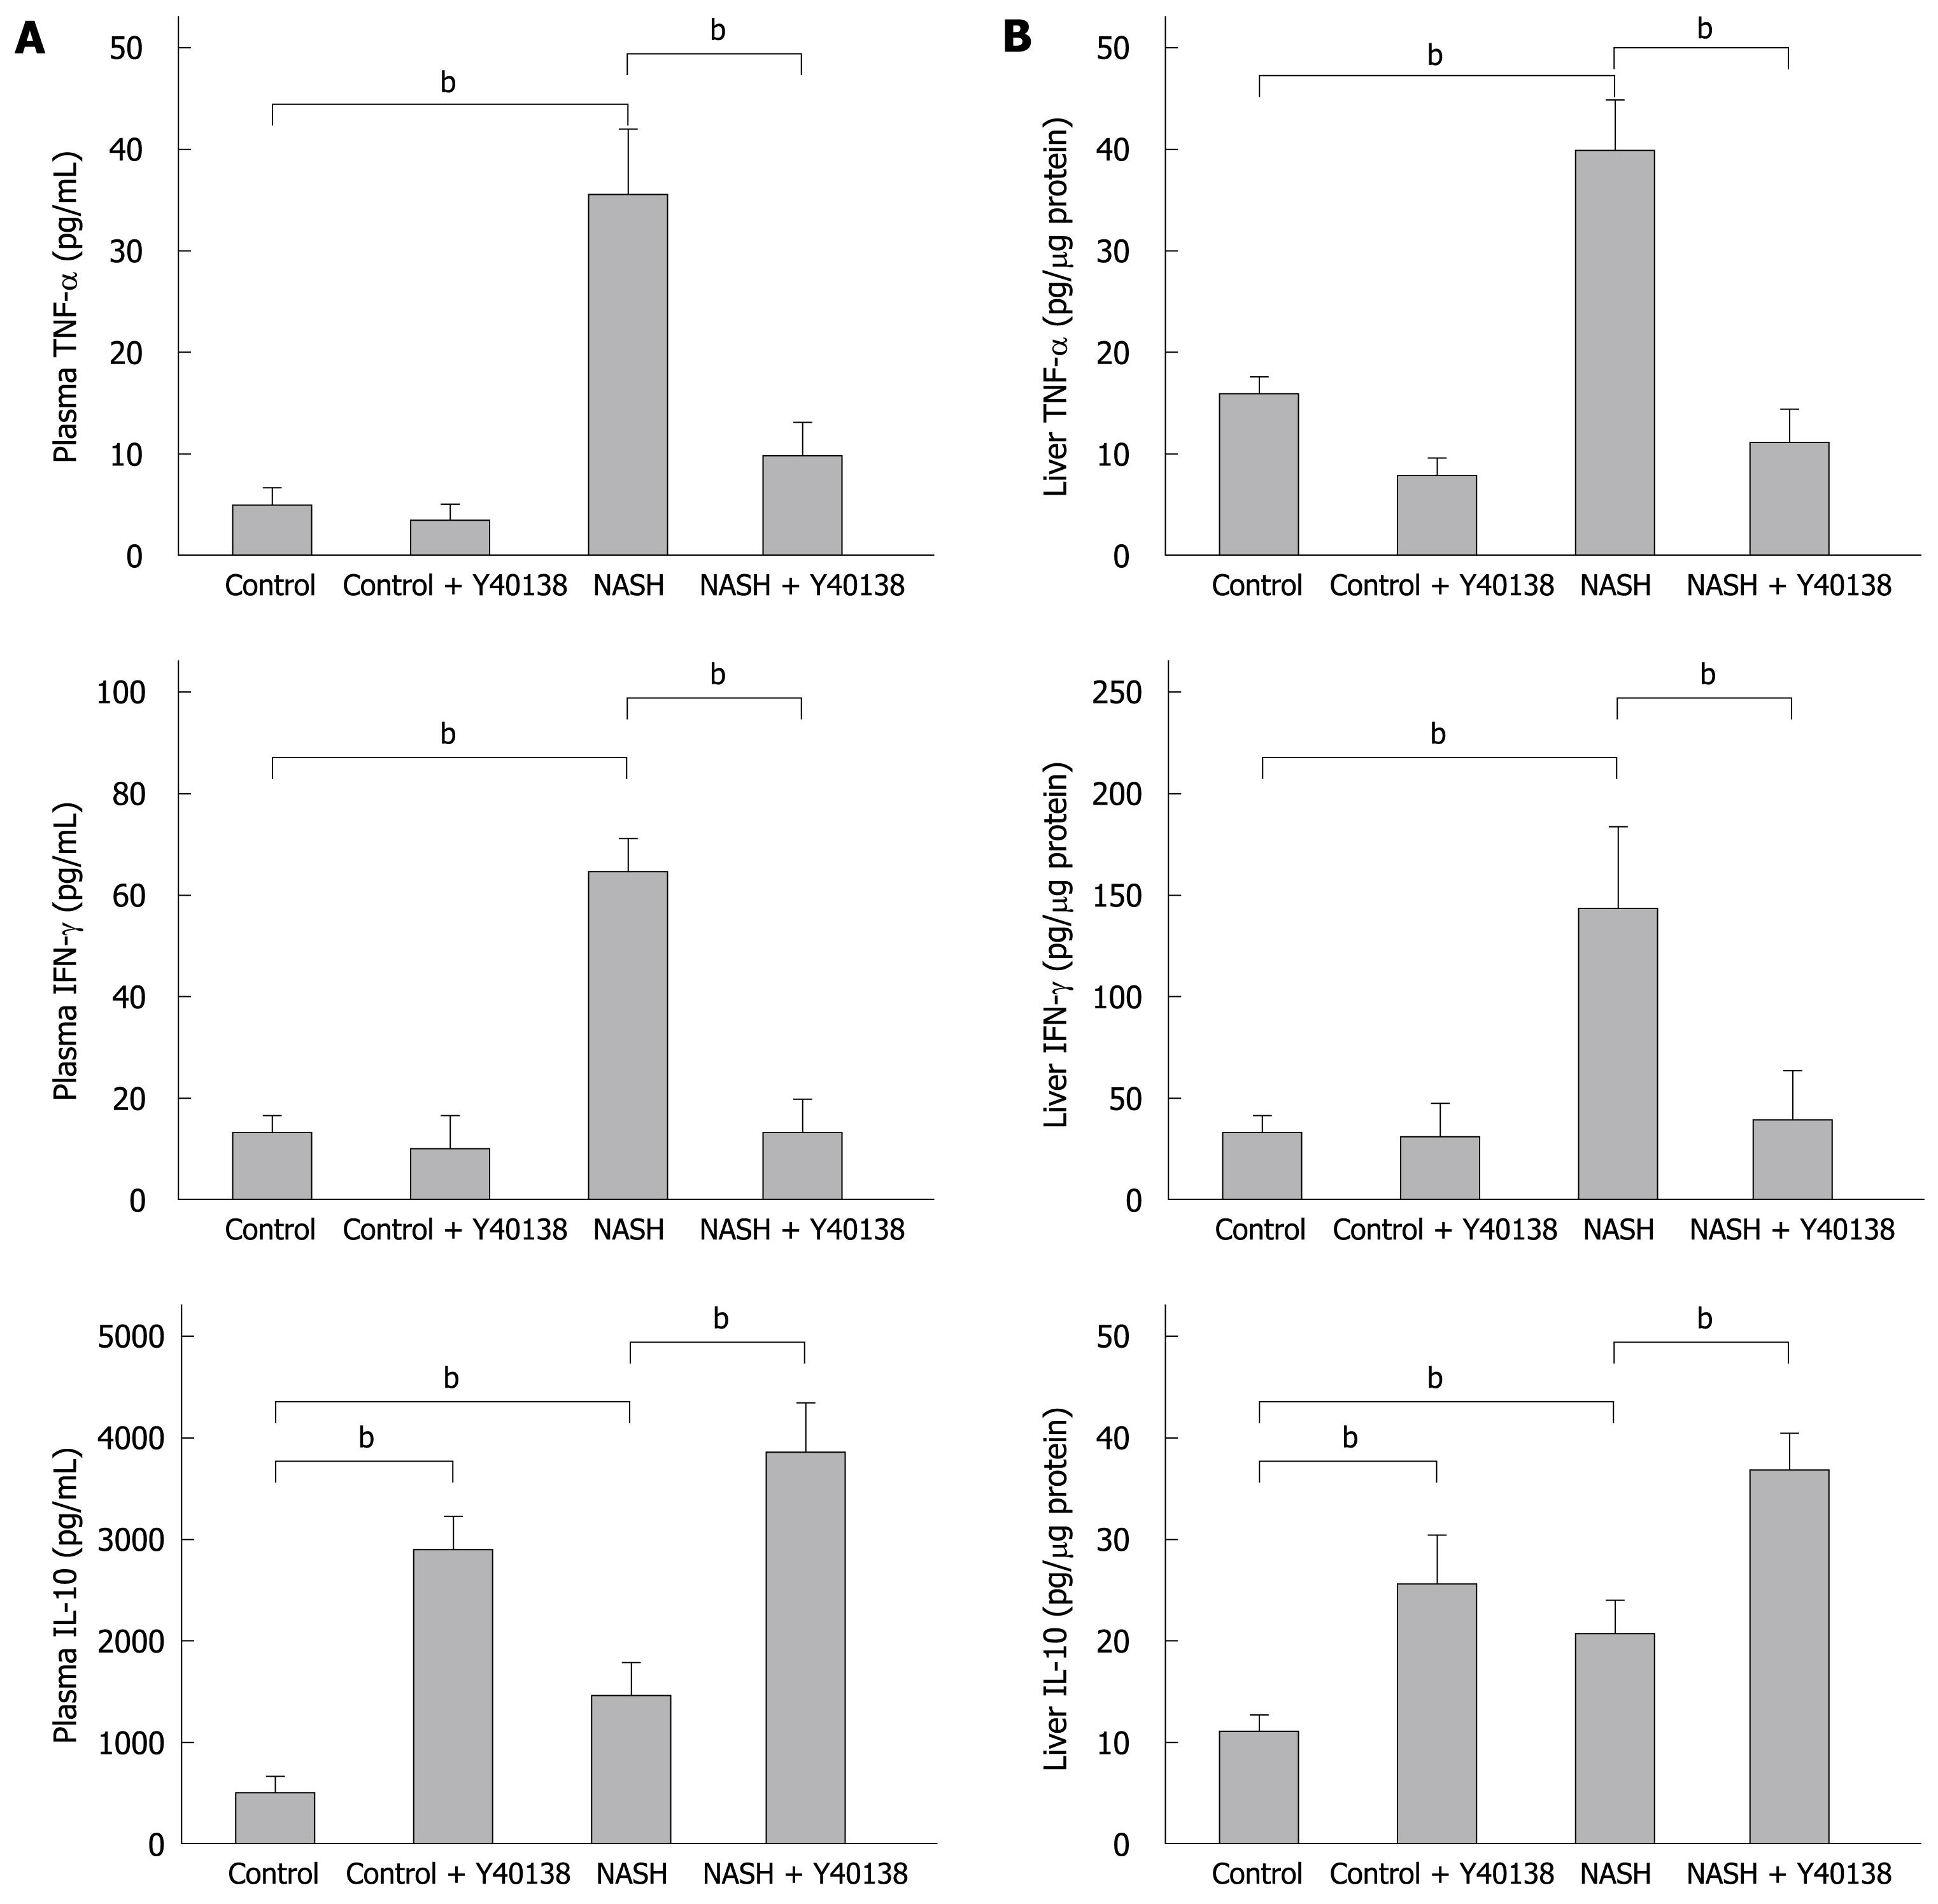
Figure 2 Tumor necrosis factor-α (TNF-α), interferon-γ (IFN-γ), and interleukin-10 (IL-10) levels in the plasma and liver (ELISA method) in each group (n = 5).
A: The plasma TNF-α and IFN-γ levels were significantly elevated in the NASH group, and the increase was attenuated in the NASH + Y-40138 group. The IL-10 levels were increased in the NASH group and further increased in the NASH + Y-40138 group rats. bP < 0.01; B: The liver TNF-α, IFN-γ and IL-10 levels were significantly elevated in the livers of the NASH group rats. TNF-α and IFN-γ levels were attenuated in the NASH + Y-40138 group. The IL-10 levels further increased in NASH + Y-40138 group rats. bP < 0.01.
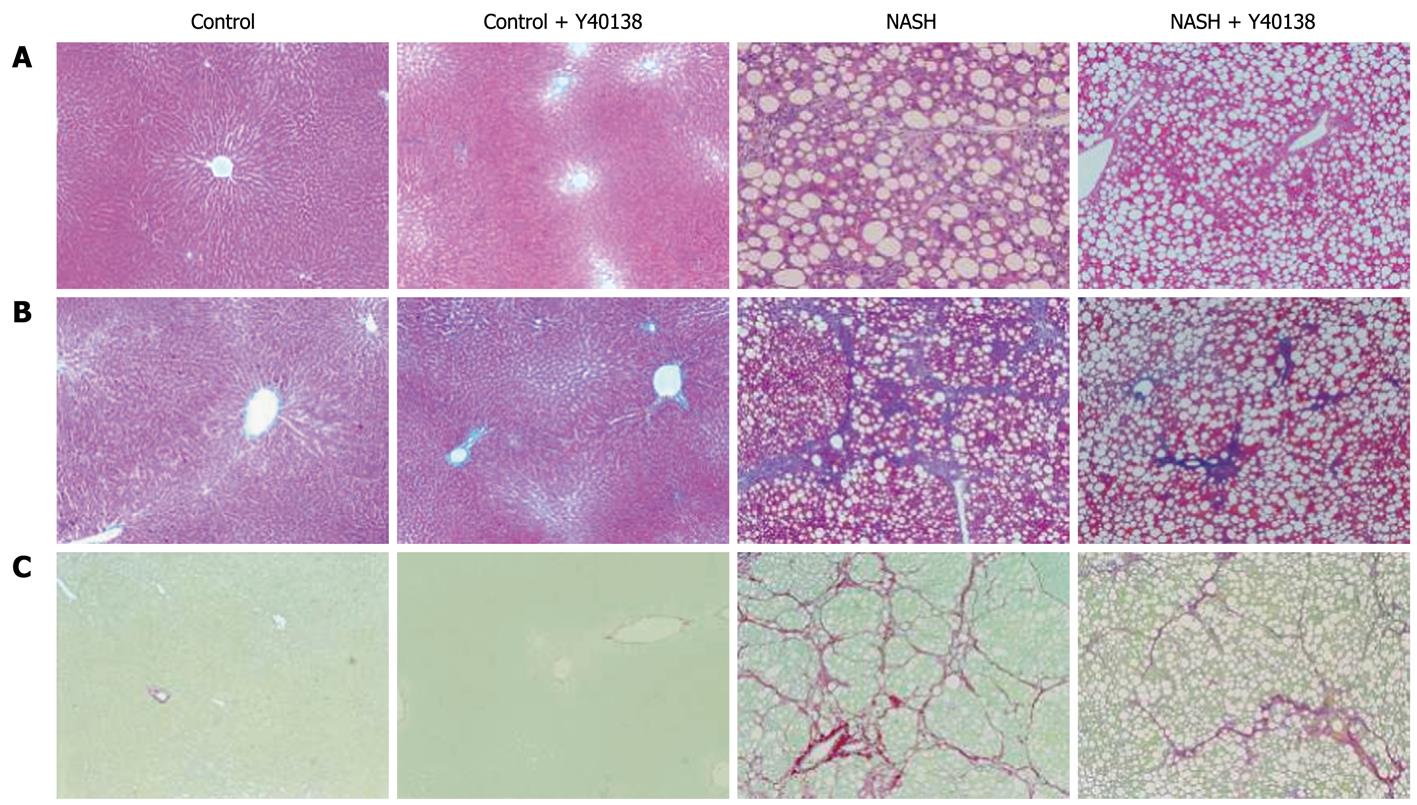
Figure 3 Histological analysis of liver sections.
A: Hematoxylin and eosin stain (× 100); B: Azan stain (× 100); C: Sirius red stain (× 100). Histological findings of liver tissue from the NASH group rats corresponded to Matteoni’s type 4 and grade 3/stage 3 of Brunt’s NASH classification. Sirius red staining revealed abundant collagen. NASH + Y-40138 group findings corresponded to Matteoni’s type 3 and Brunt’s grade 2/stage 2, and showed amelioration of inflammation and fibrosis in comparison to the NASH group (n = 5).
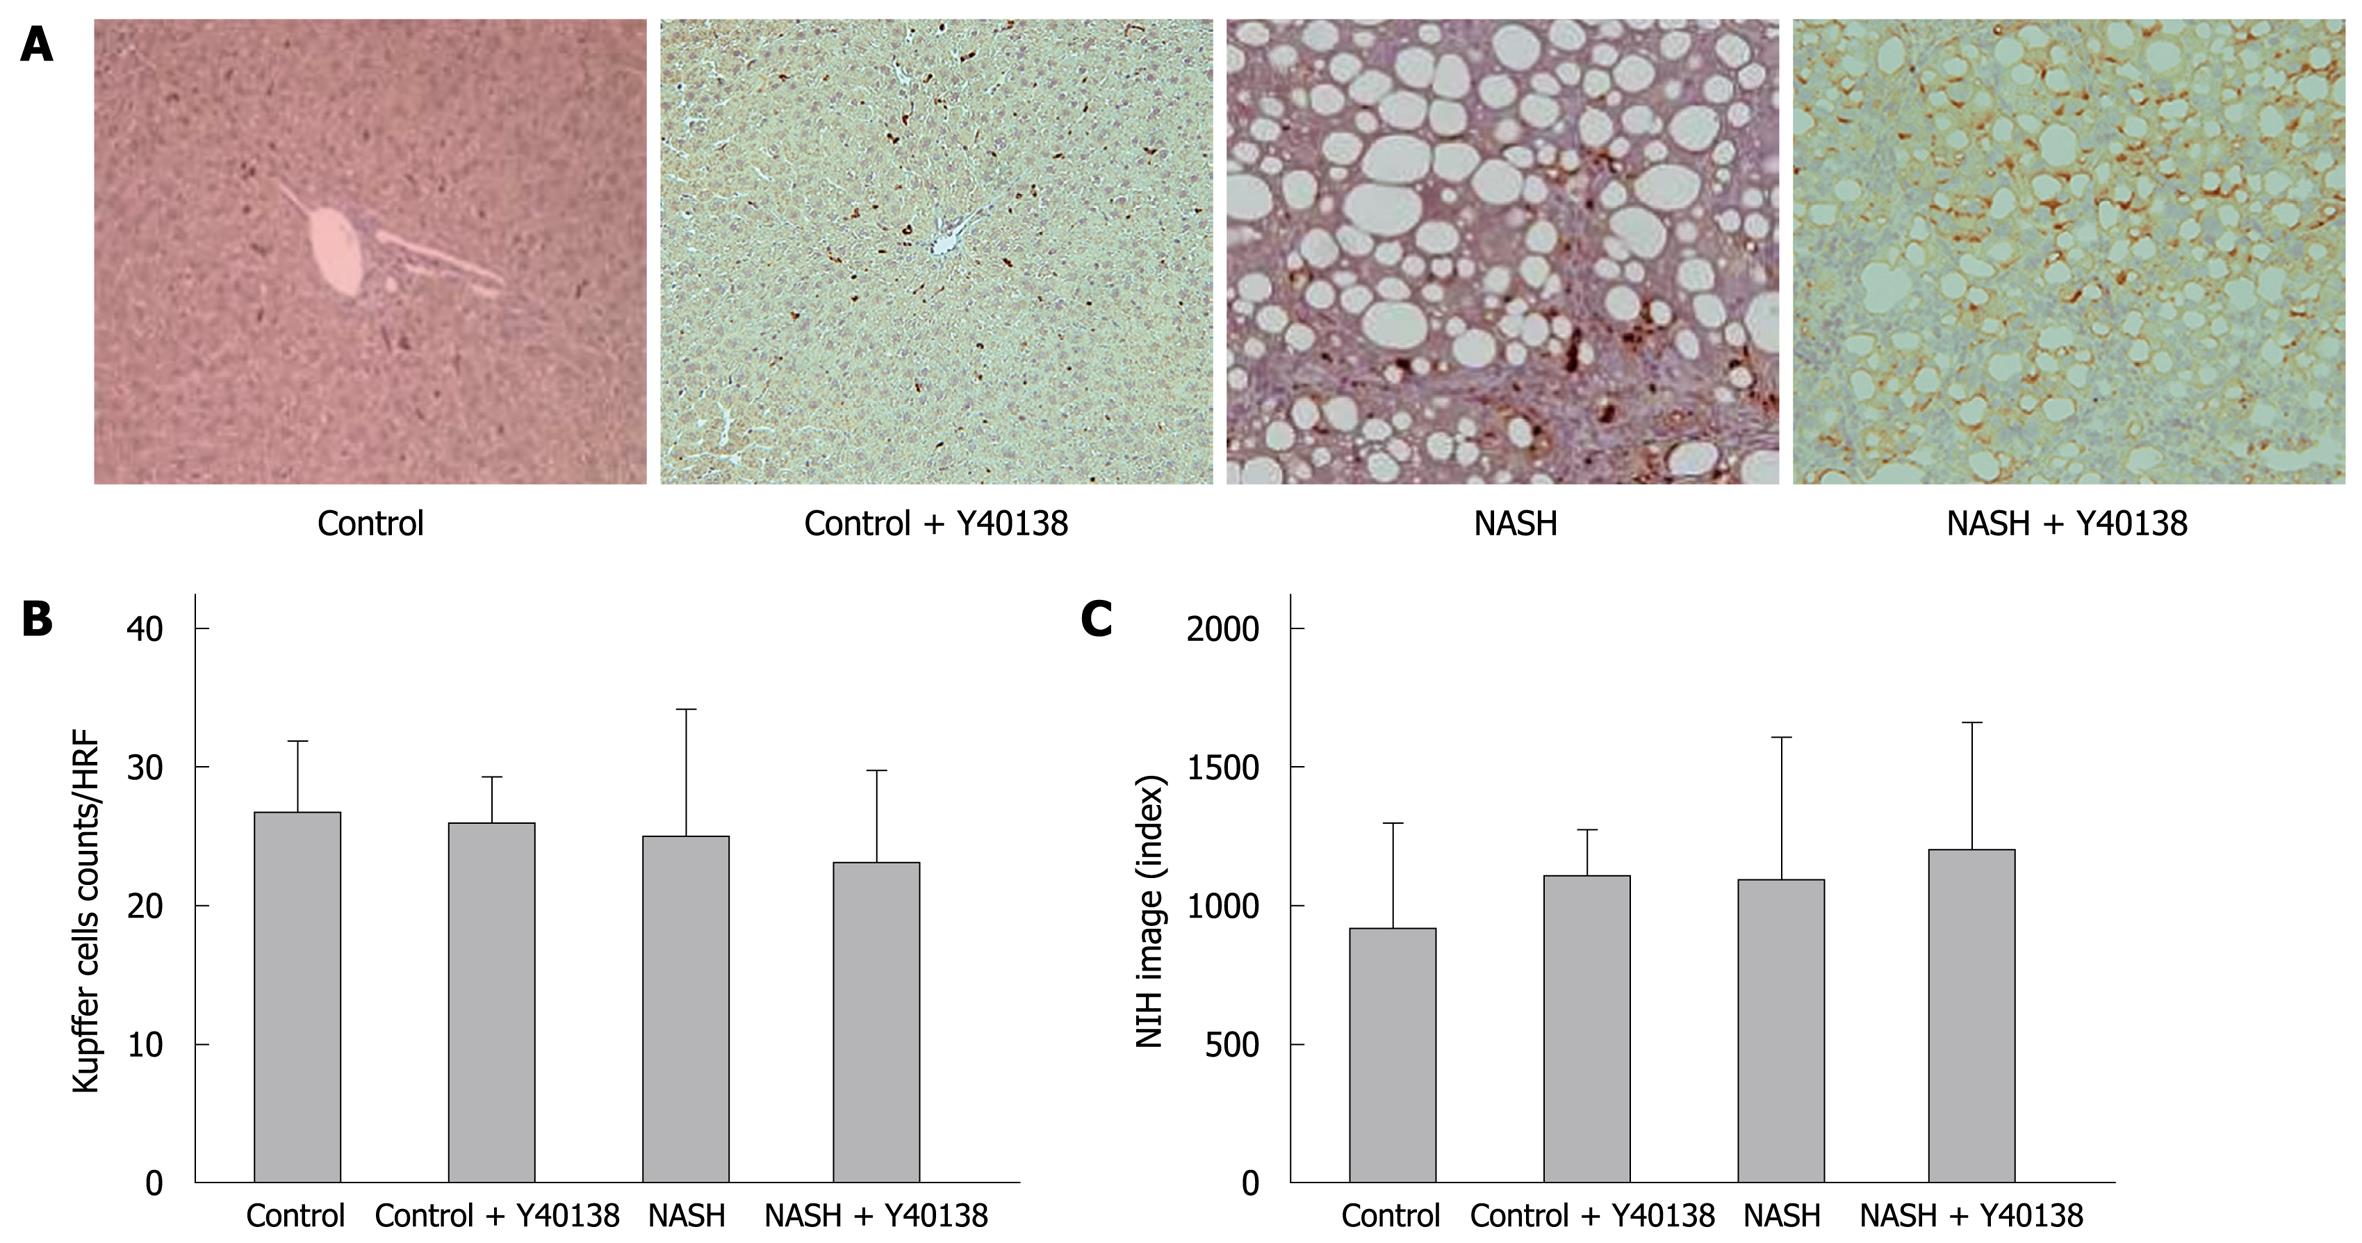
Figure 4 Kupffer cell immunohistochemical staining, Kupffer cell number and semiquantification in the liver.
A: Kupffer cell immunohistochemical staining (× 200). Brown-stained cells are positive; B: No significant differences were seen between groups in the stained cell counts per field; C: Quantitative analysis revealed no significant differences between groups (n = 5). HRF: High rise filed.
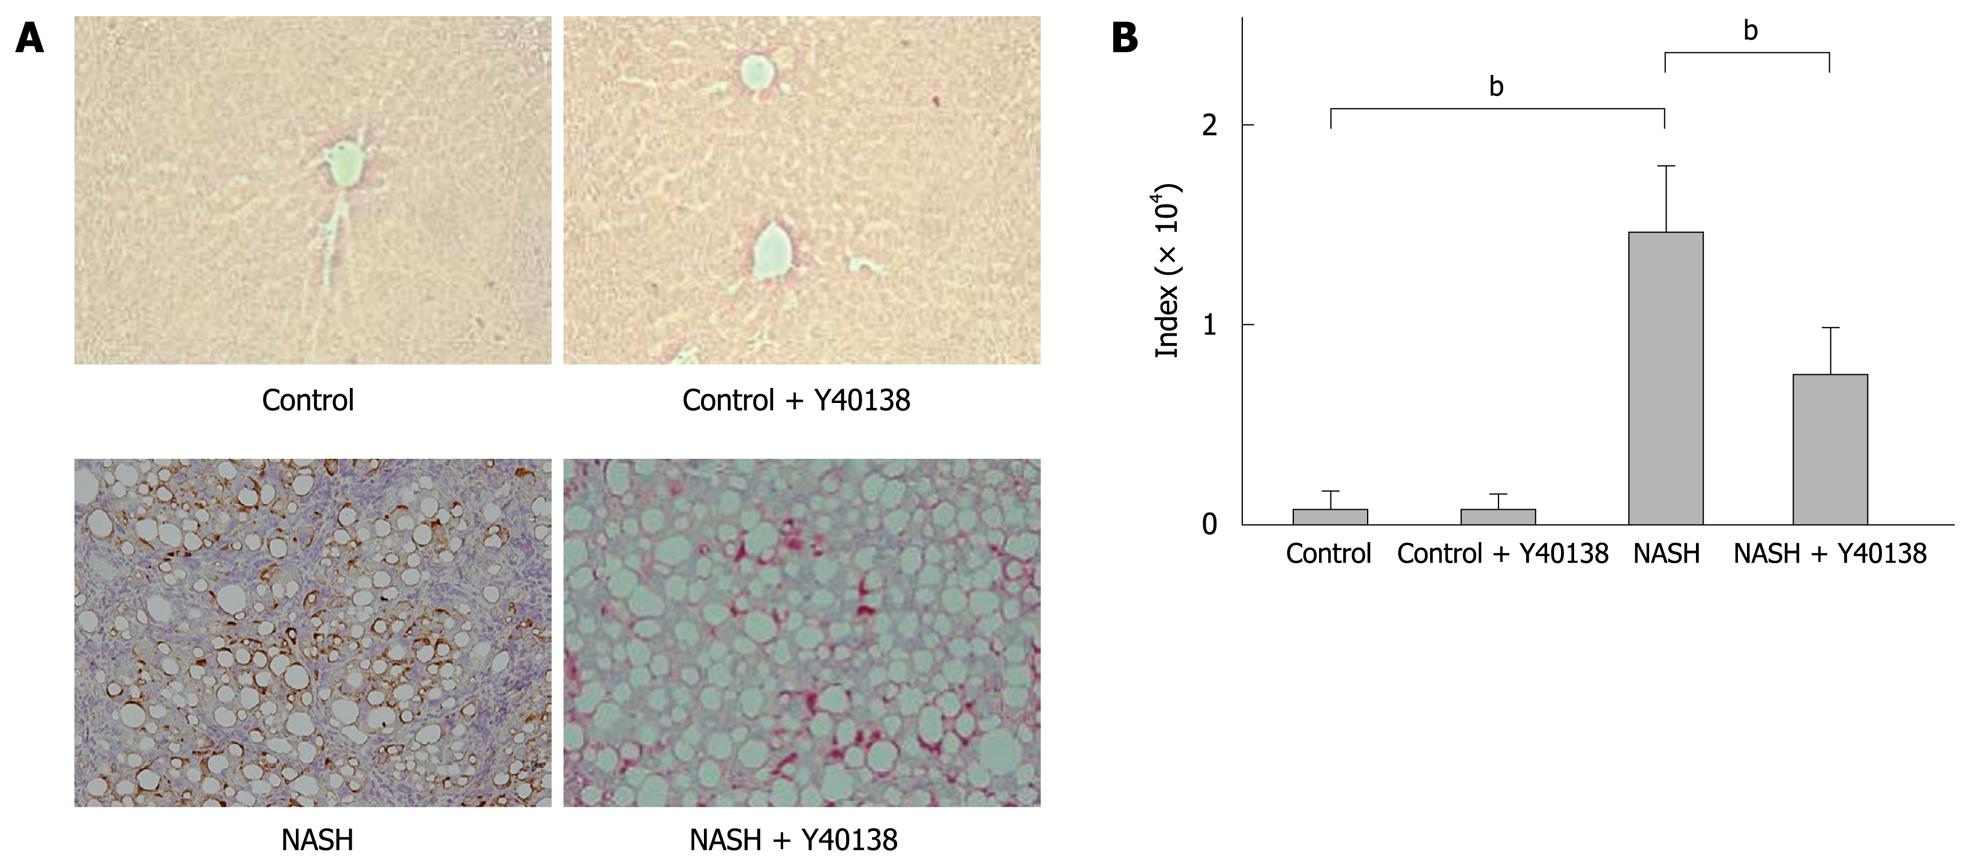
Figure 5 TNF-α immunohistochemical staining and semiquantification.
A: TNF-α immunohistochemical staining (× 200). Brown-stained cells are positive; B: TNF-α immunoreactivities in the tissue samples from the NASH group were increased in comparison to the control group. The TNF-α immunoreactivities in the NASH + Y-40138 group were decreased in comparison to the NASH group (n = 5). bP < 0.01.
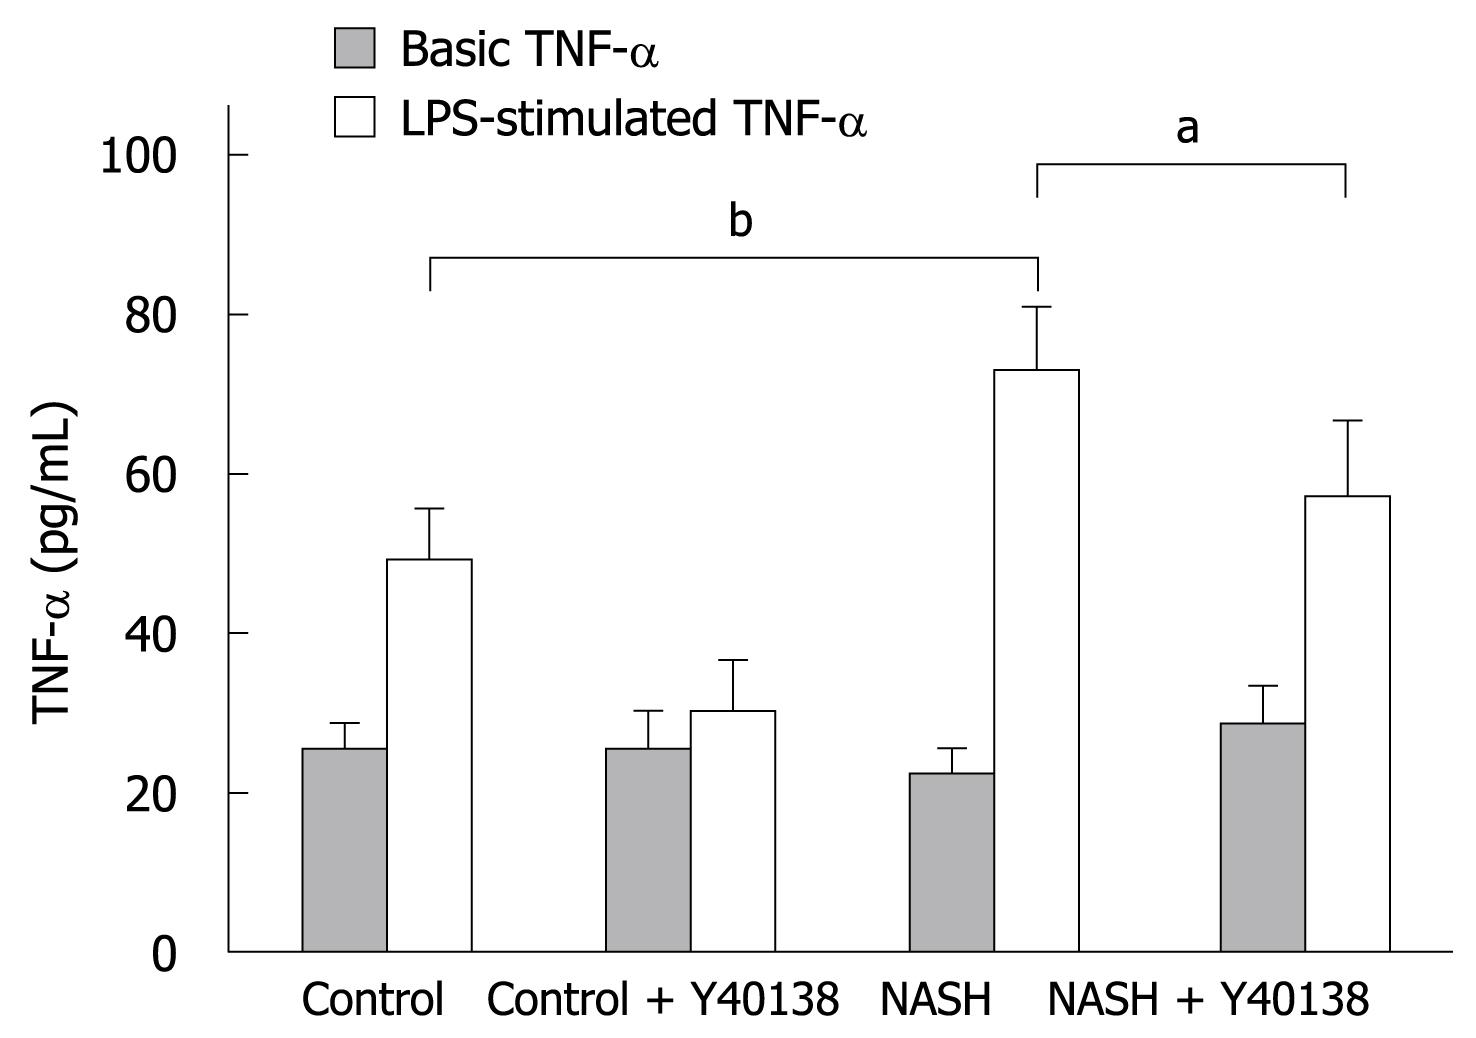
Figure 6 In-vitro TNF-α production by Kupffer cells.
The basal TNF-α production by Kupffer cells isolated from the NASH group (26.6 ± 3.4 pg/mL) was equal to that in the control group (23.4 ± 4.8 pg/mL). After lipopolysaccharide (LPS) stimulation, TNF-α production in the control group (48.9 ± 7.5 pg/mL) was significantly higher than the basal control level, and was significantly higher in the NASH group (73.8 ± 8.4 pg/mL) than in the control group (n = 5). bP < 0.01. TNF-α production in the NASH + Y-40138 group (57.2 ± 10.3 pg/mL) was significantly decreased in comparison to the NASH group (n = 5). aP < 0.05.
- Citation: Tsujimoto T, Kawaratani H, Kitazawa T, Yoshiji H, Fujimoto M, Uemura M, Fukui H. Immunotherapy for nonalcoholic steatohepatitis using the multiple cytokine production modulator Y-40138. World J Gastroenterol 2009; 15(44): 5533-5540
- URL: https://www.wjgnet.com/1007-9327/full/v15/i44/5533.htm
- DOI: https://dx.doi.org/10.3748/wjg.15.5533


