Copyright
©2009 The WJG Press and Baishideng.
World J Gastroenterol. Nov 28, 2009; 15(44): 5533-5540
Published online Nov 28, 2009. doi: 10.3748/wjg.15.5533
Published online Nov 28, 2009. doi: 10.3748/wjg.15.5533
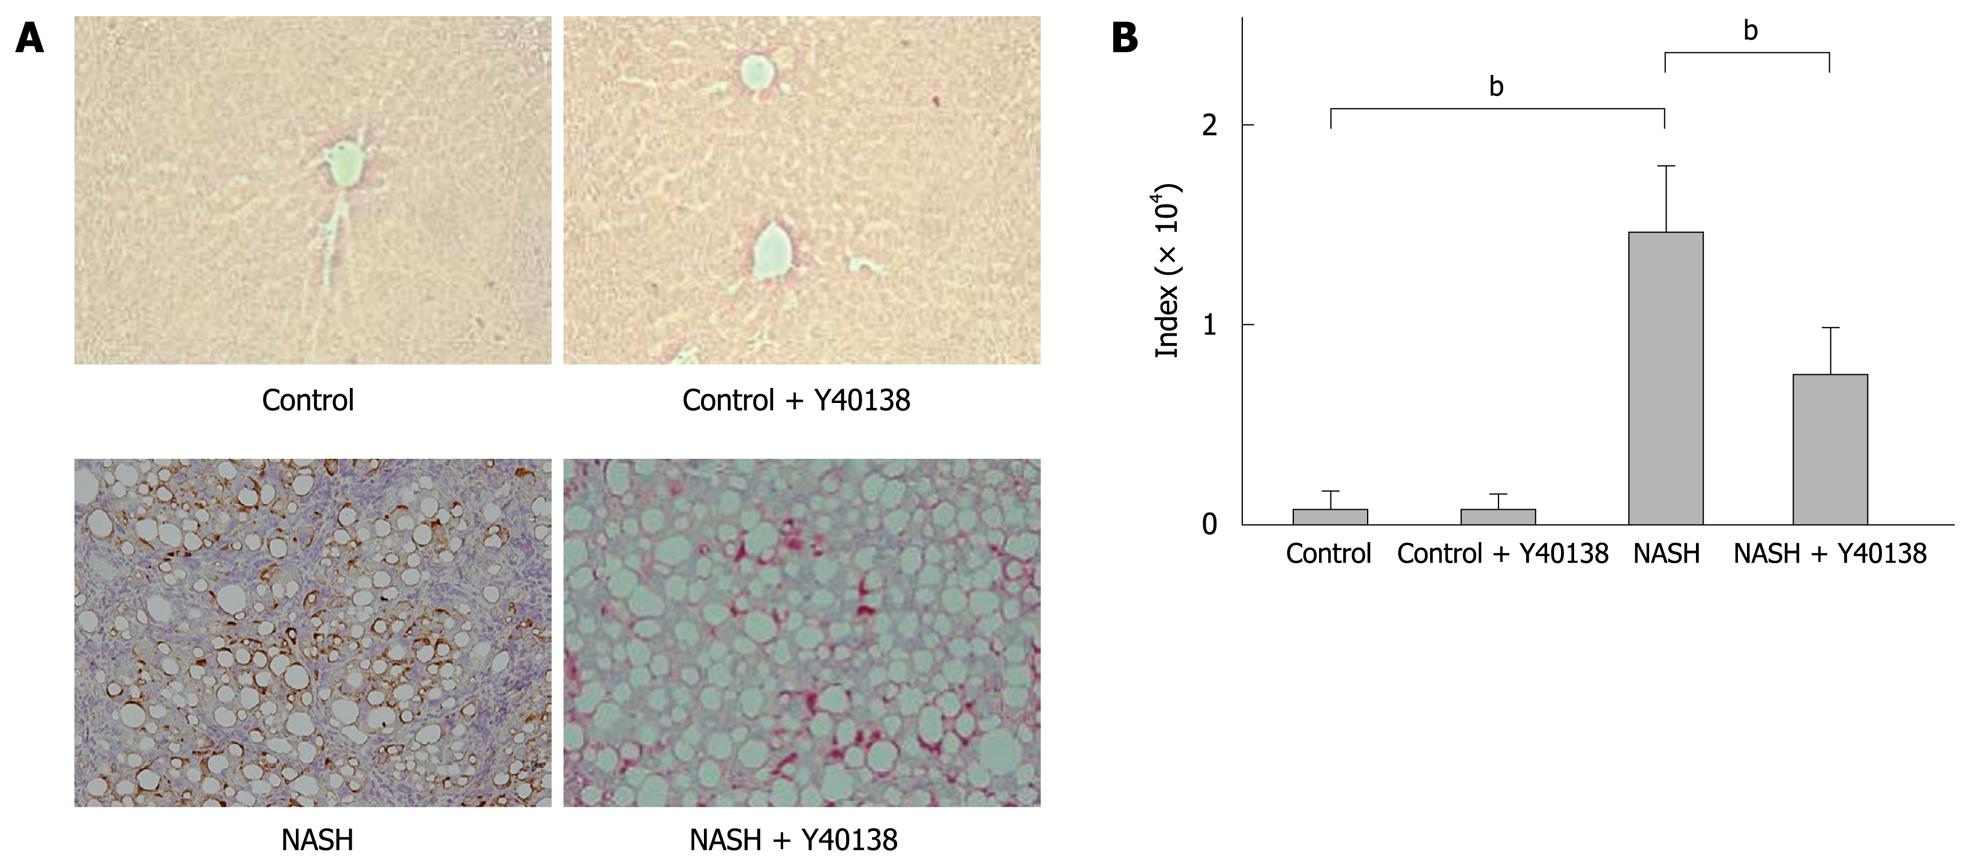
Figure 5 TNF-α immunohistochemical staining and semiquantification.
A: TNF-α immunohistochemical staining (× 200). Brown-stained cells are positive; B: TNF-α immunoreactivities in the tissue samples from the NASH group were increased in comparison to the control group. The TNF-α immunoreactivities in the NASH + Y-40138 group were decreased in comparison to the NASH group (n = 5). bP < 0.01.
- Citation: Tsujimoto T, Kawaratani H, Kitazawa T, Yoshiji H, Fujimoto M, Uemura M, Fukui H. Immunotherapy for nonalcoholic steatohepatitis using the multiple cytokine production modulator Y-40138. World J Gastroenterol 2009; 15(44): 5533-5540
- URL: https://www.wjgnet.com/1007-9327/full/v15/i44/5533.htm
- DOI: https://dx.doi.org/10.3748/wjg.15.5533


