Copyright
©2009 The WJG Press and Baishideng.
World J Gastroenterol. Nov 7, 2009; 15(41): 5176-5180
Published online Nov 7, 2009. doi: 10.3748/wjg.15.5176
Published online Nov 7, 2009. doi: 10.3748/wjg.15.5176
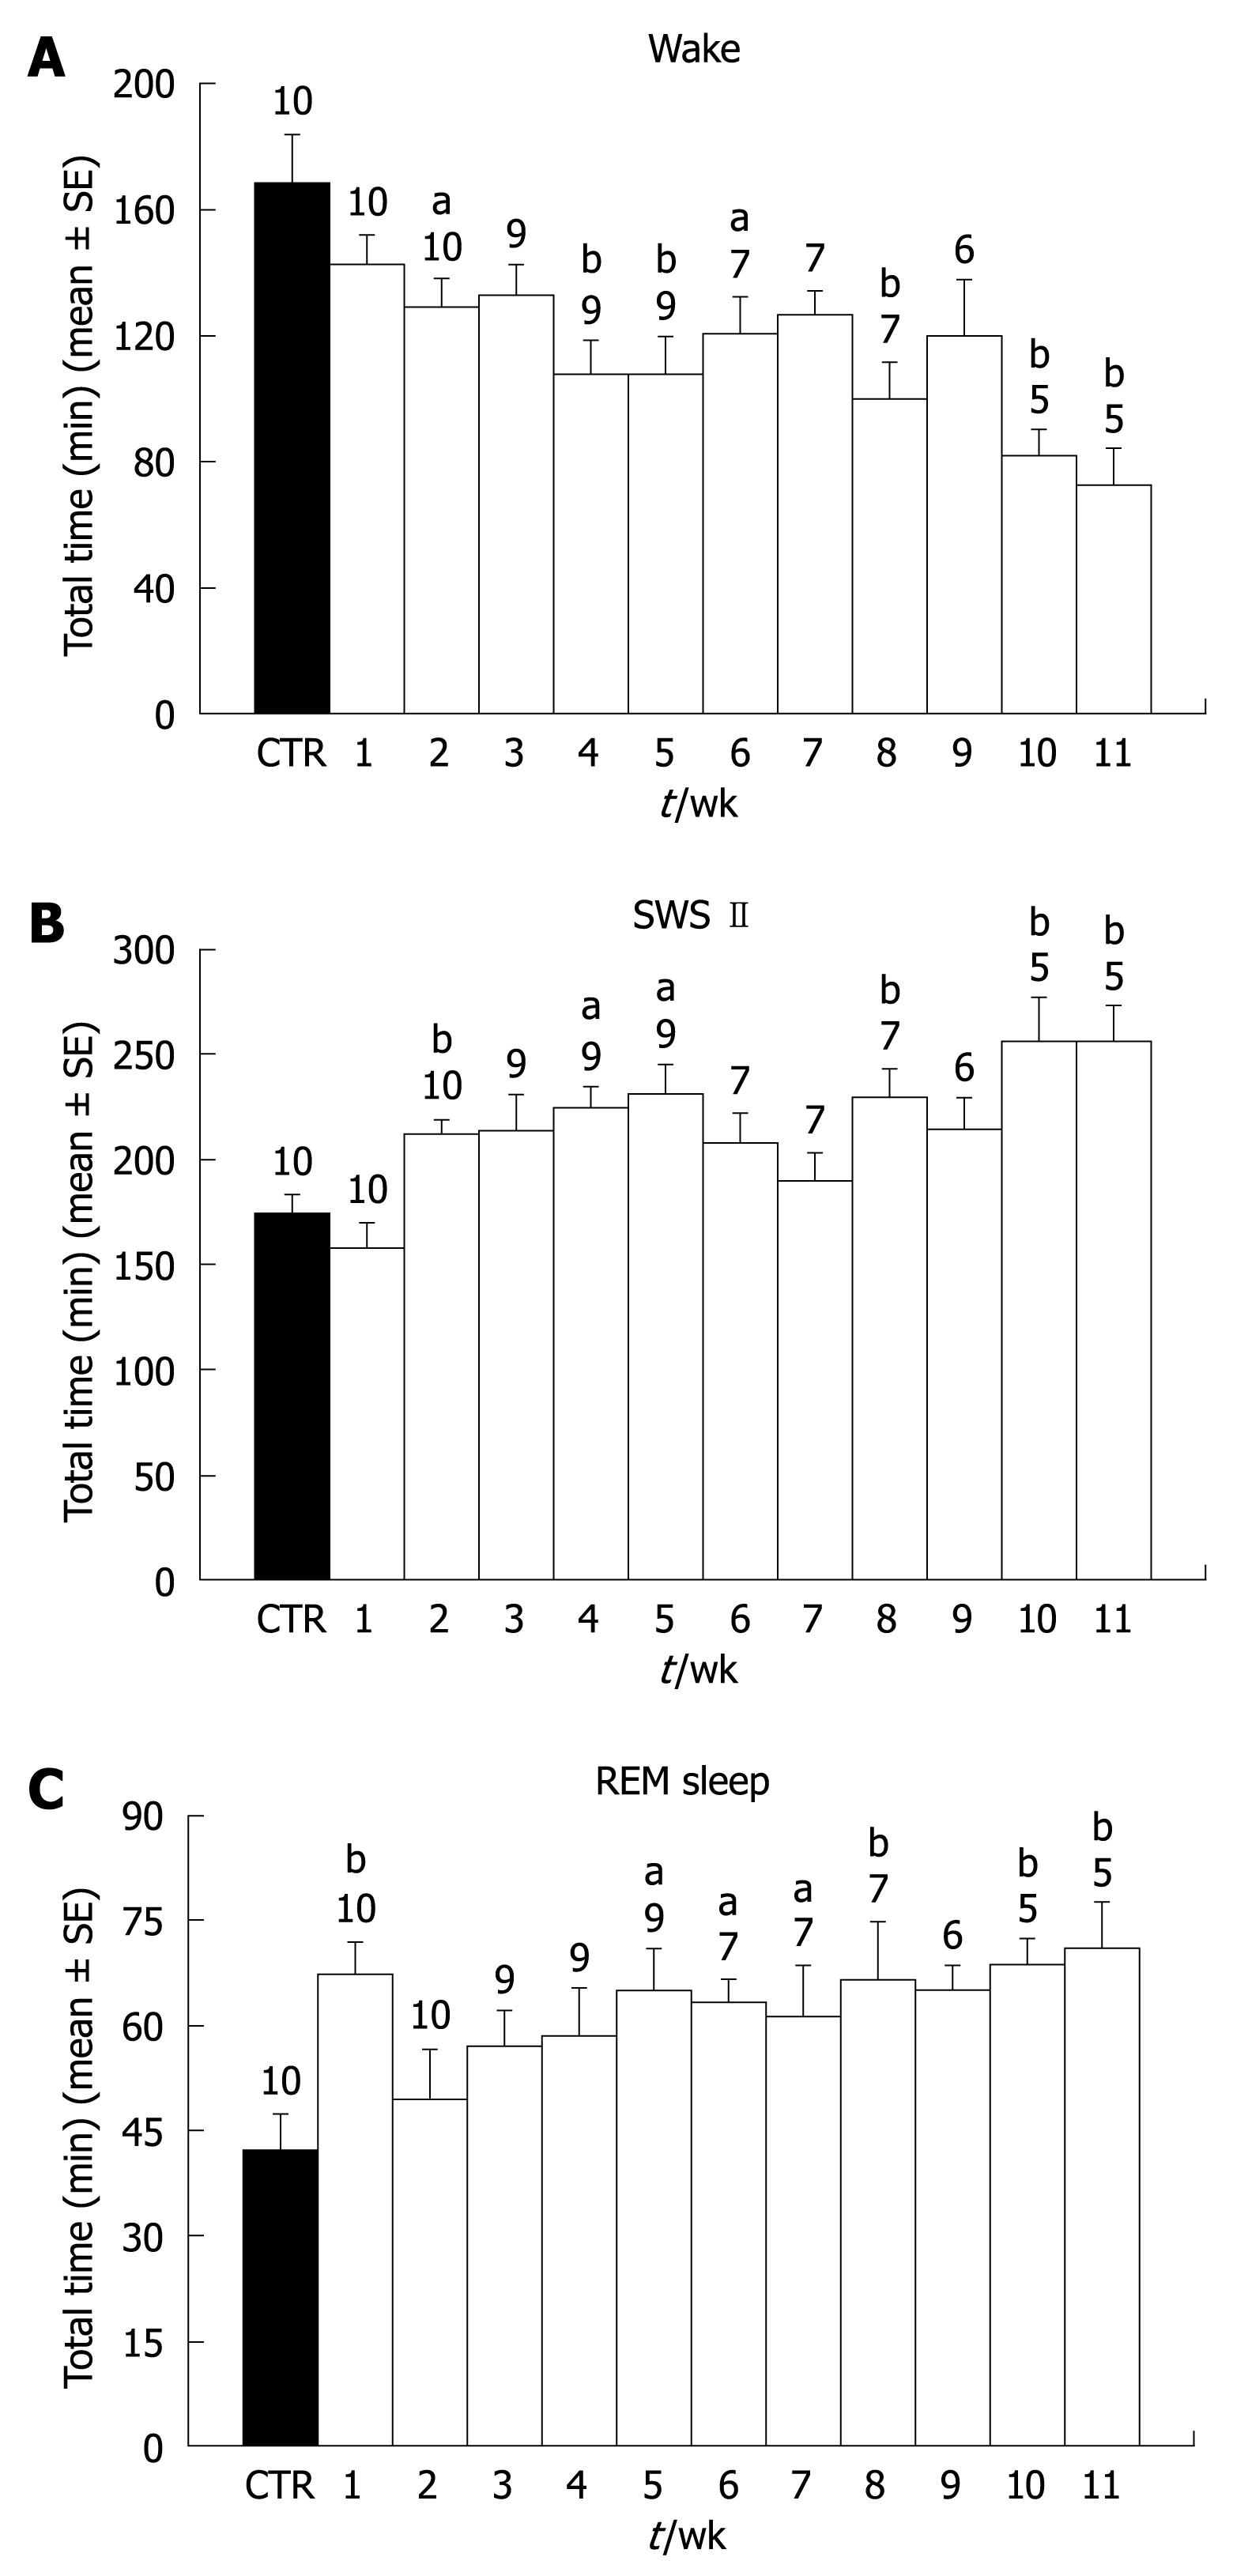
Figure 1 Percentage of Wakefulness (A), SWS II (B), and REM sleep (C) in weekly 8 h sleep recordings during treatment with CCl4.
Numbers at the top of the bars express the number of subjects. aP < 0.05, bP < 0.01 vs control. Repeated measurements were analyzed by ANOVA.
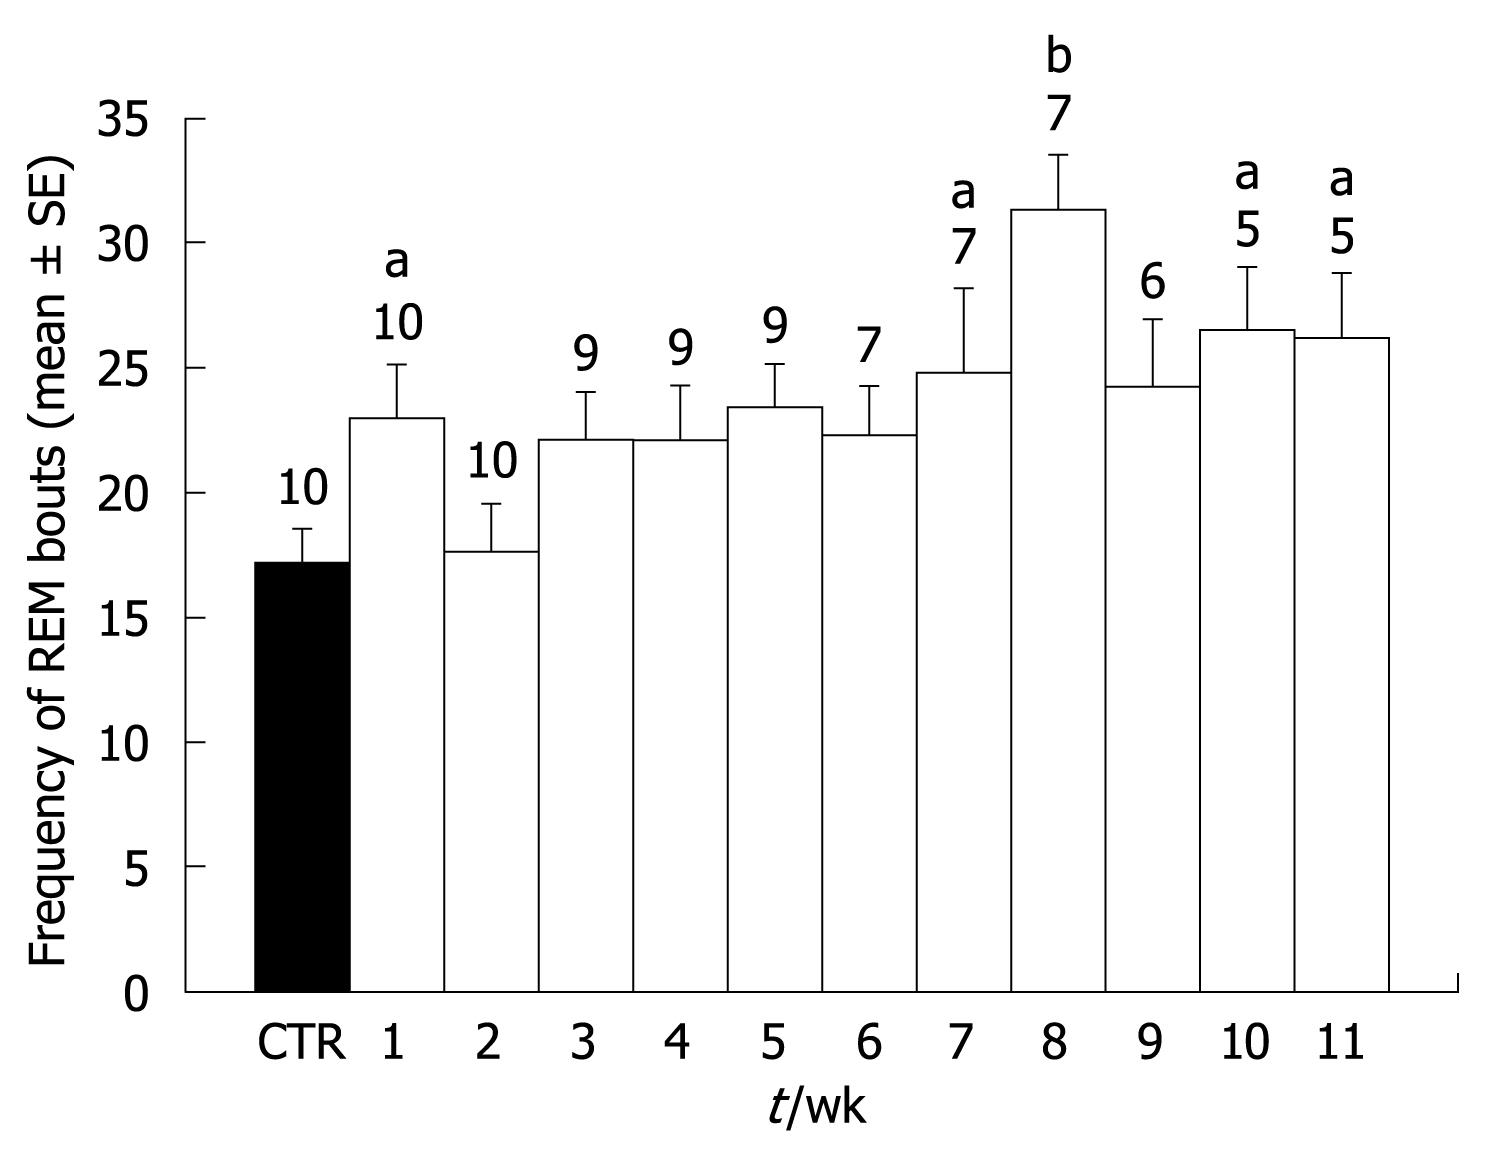
Figure 2 Frequency of REM sleep bouts observed in weekly eight-hour sleep recordings during treatment with CCl4.
Numbers at the top of the bars express the number of subjects. aP < 0.05, bP < 0.01 vs control. Repeated measurements were analyzed by ANOVA.
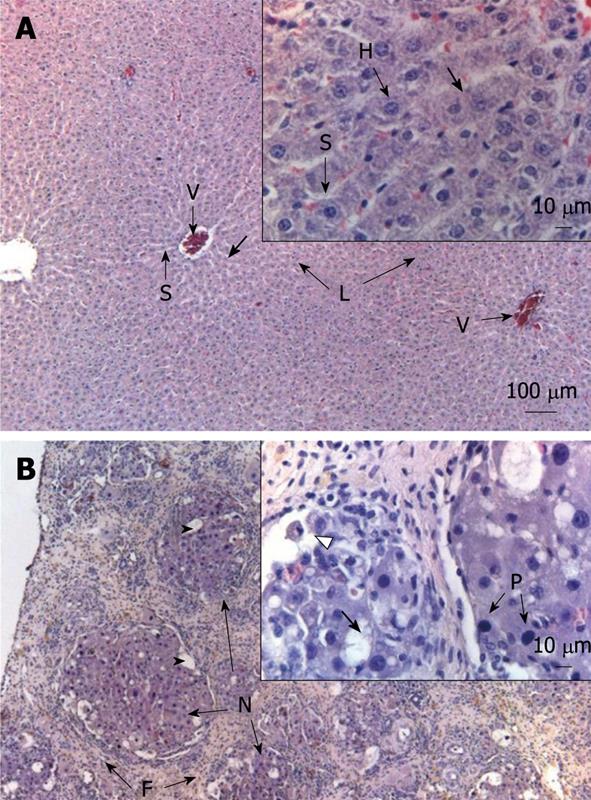
Figure 3 Effects of repeated administration of CCl4 on liver morphology in rats after 11 wk of CCl4 treatment.
A: Normal aspect of an untreated liver. In a stain with HE, the typical sinusoidal (S) organization can be observed with lobules (L) surrounding the vessels (V). In a higher magnification, a normal hepatocyte (H) can be distinguished; B: The effects of CCl4. A fibrotic process (F) is evident, with hepatocytes grouped in nodules (N) containing vacuoles. In a higher magnification, the bold arrow indicates hepatocytes with lipidic vacuoles can be observed as well as cells with pycnotic nucleus (P) or in necrosis (triangle).
- Citation: Jiménez-Anguiano A, Díaz-Medina V, Farfán-Labonne BE, Giono-Chiang G, Kersenobich D, García-Lorenzana M, Gutiérrez-Ruiz MC, Velázquez-Moctezuma J. Modification of sleep architecture in an animal model of experimental cirrhosis. World J Gastroenterol 2009; 15(41): 5176-5180
- URL: https://www.wjgnet.com/1007-9327/full/v15/i41/5176.htm
- DOI: https://dx.doi.org/10.3748/wjg.15.5176


