Copyright
©2009 The WJG Press and Baishideng.
World J Gastroenterol. Sep 28, 2009; 15(36): 4518-4528
Published online Sep 28, 2009. doi: 10.3748/wjg.15.4518
Published online Sep 28, 2009. doi: 10.3748/wjg.15.4518
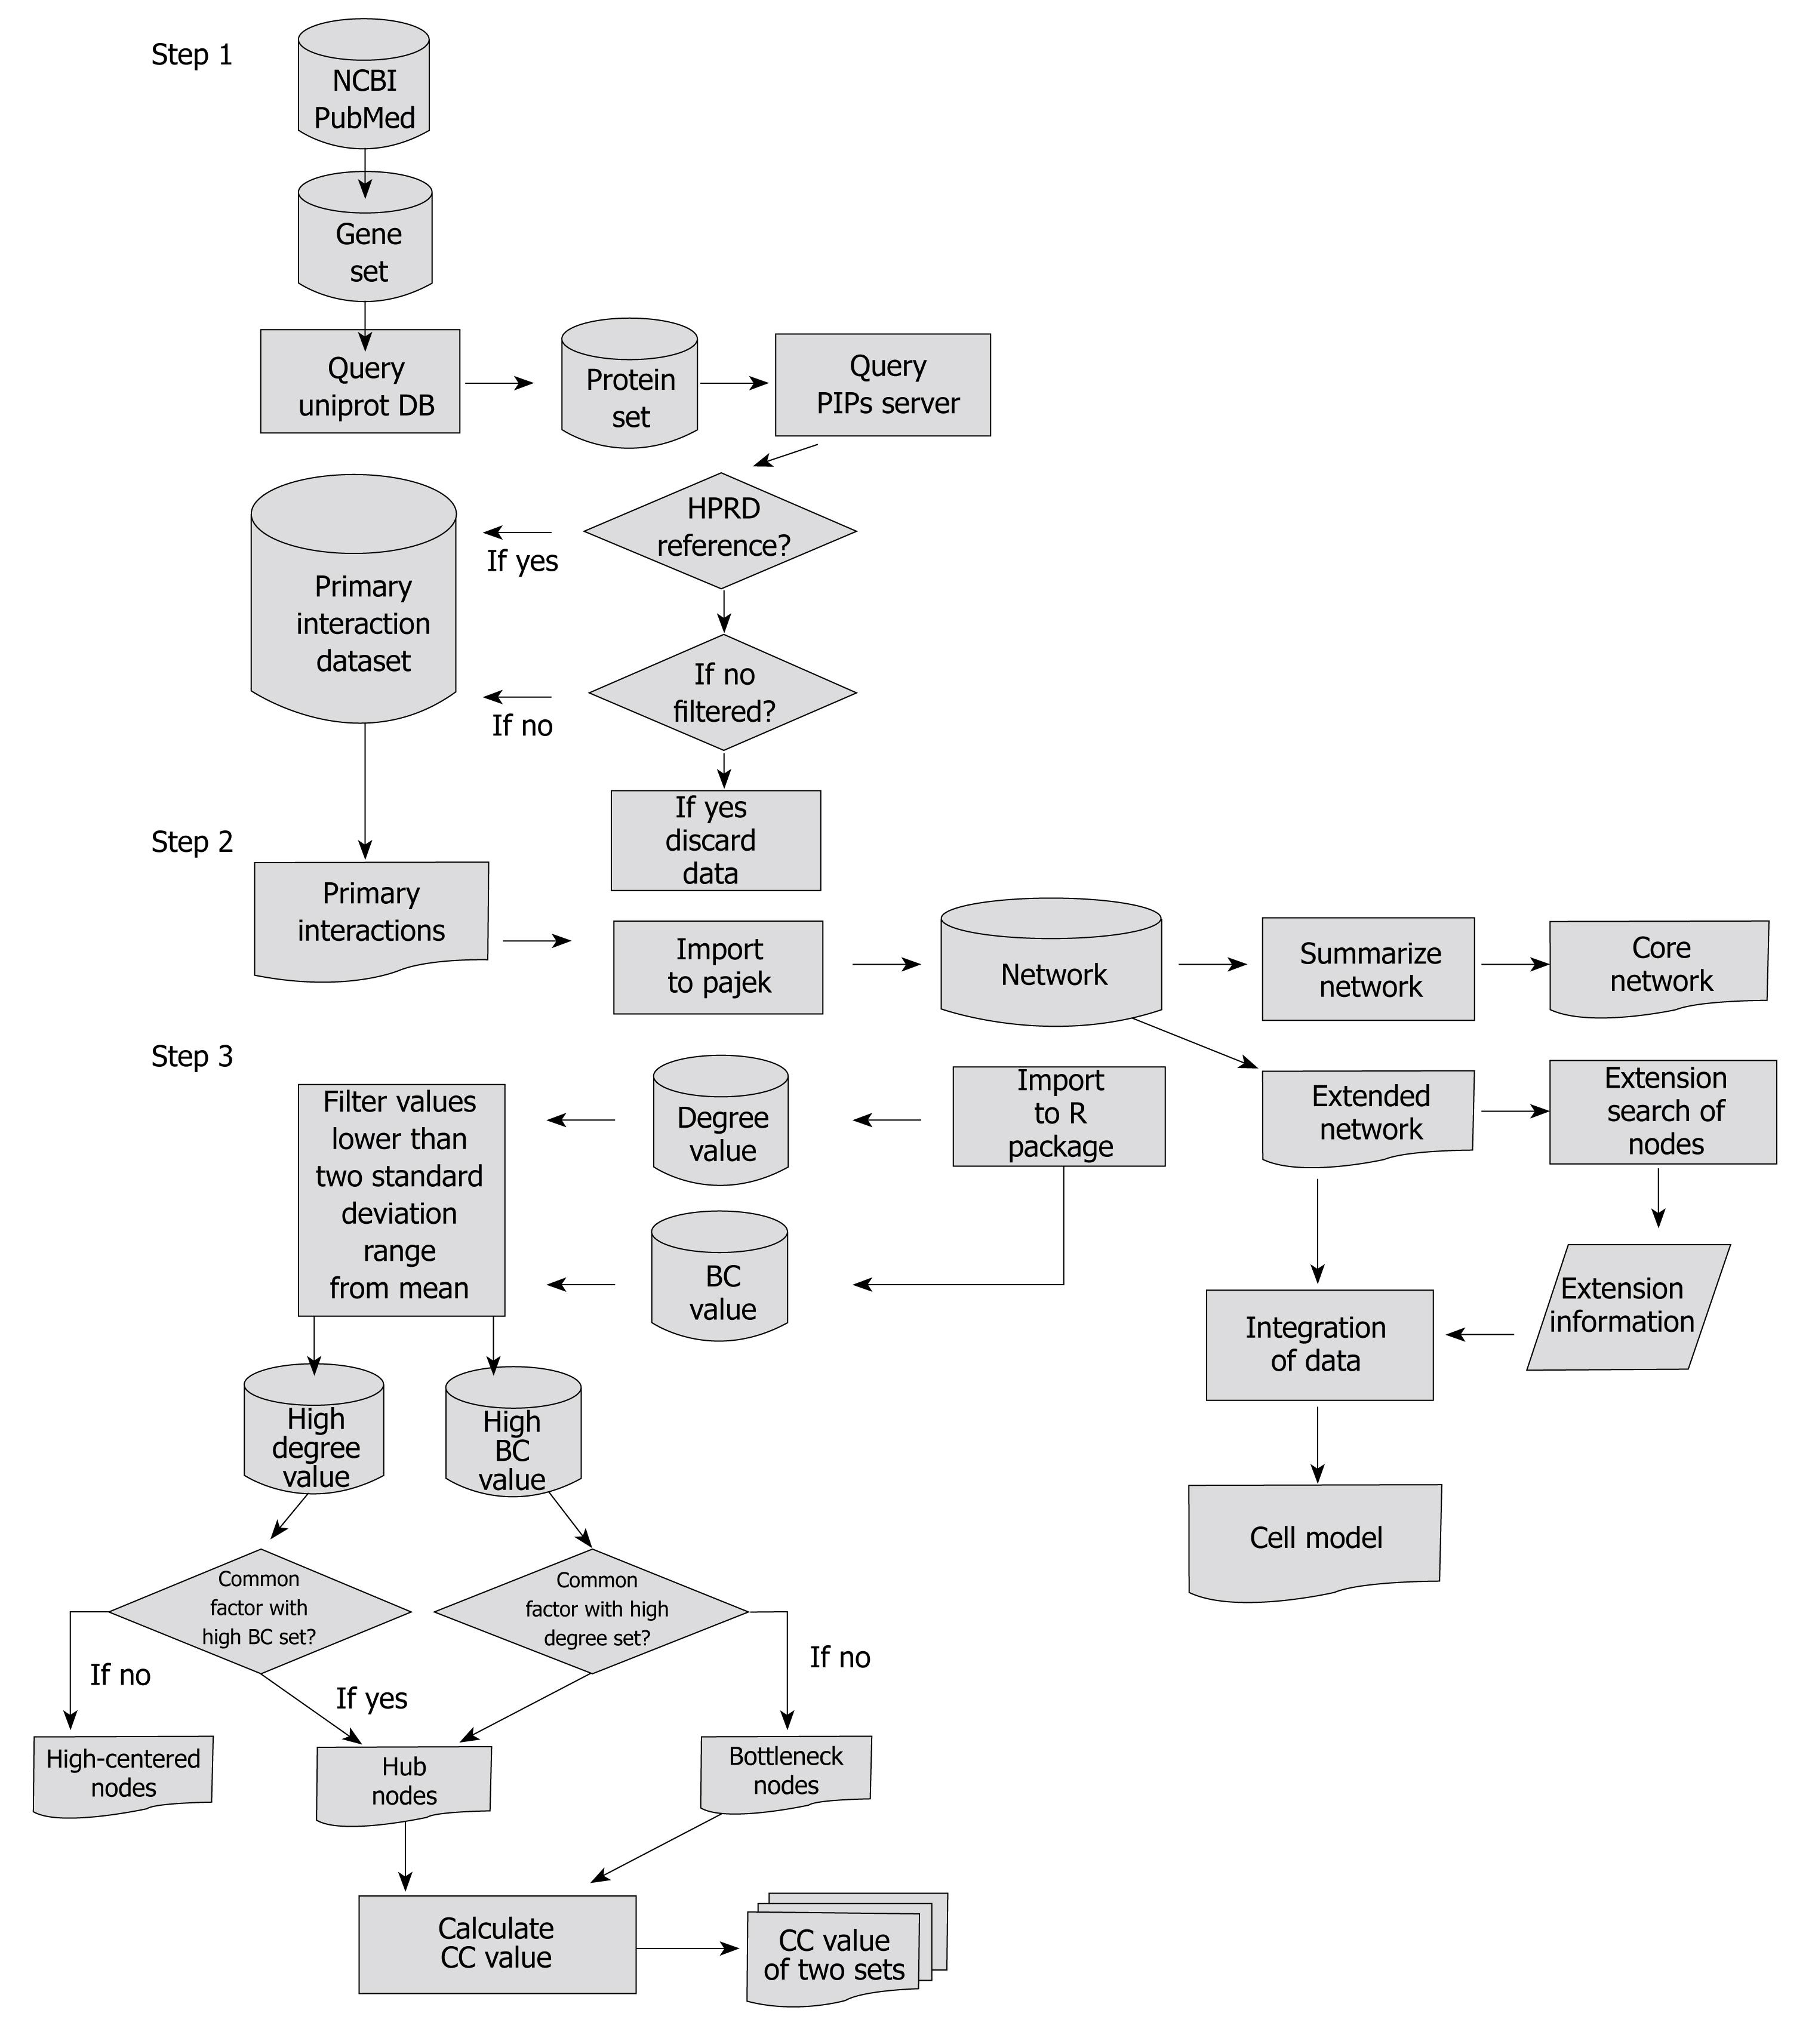
Figure 1 Flow chart showing overall methods and data flow used in this study.
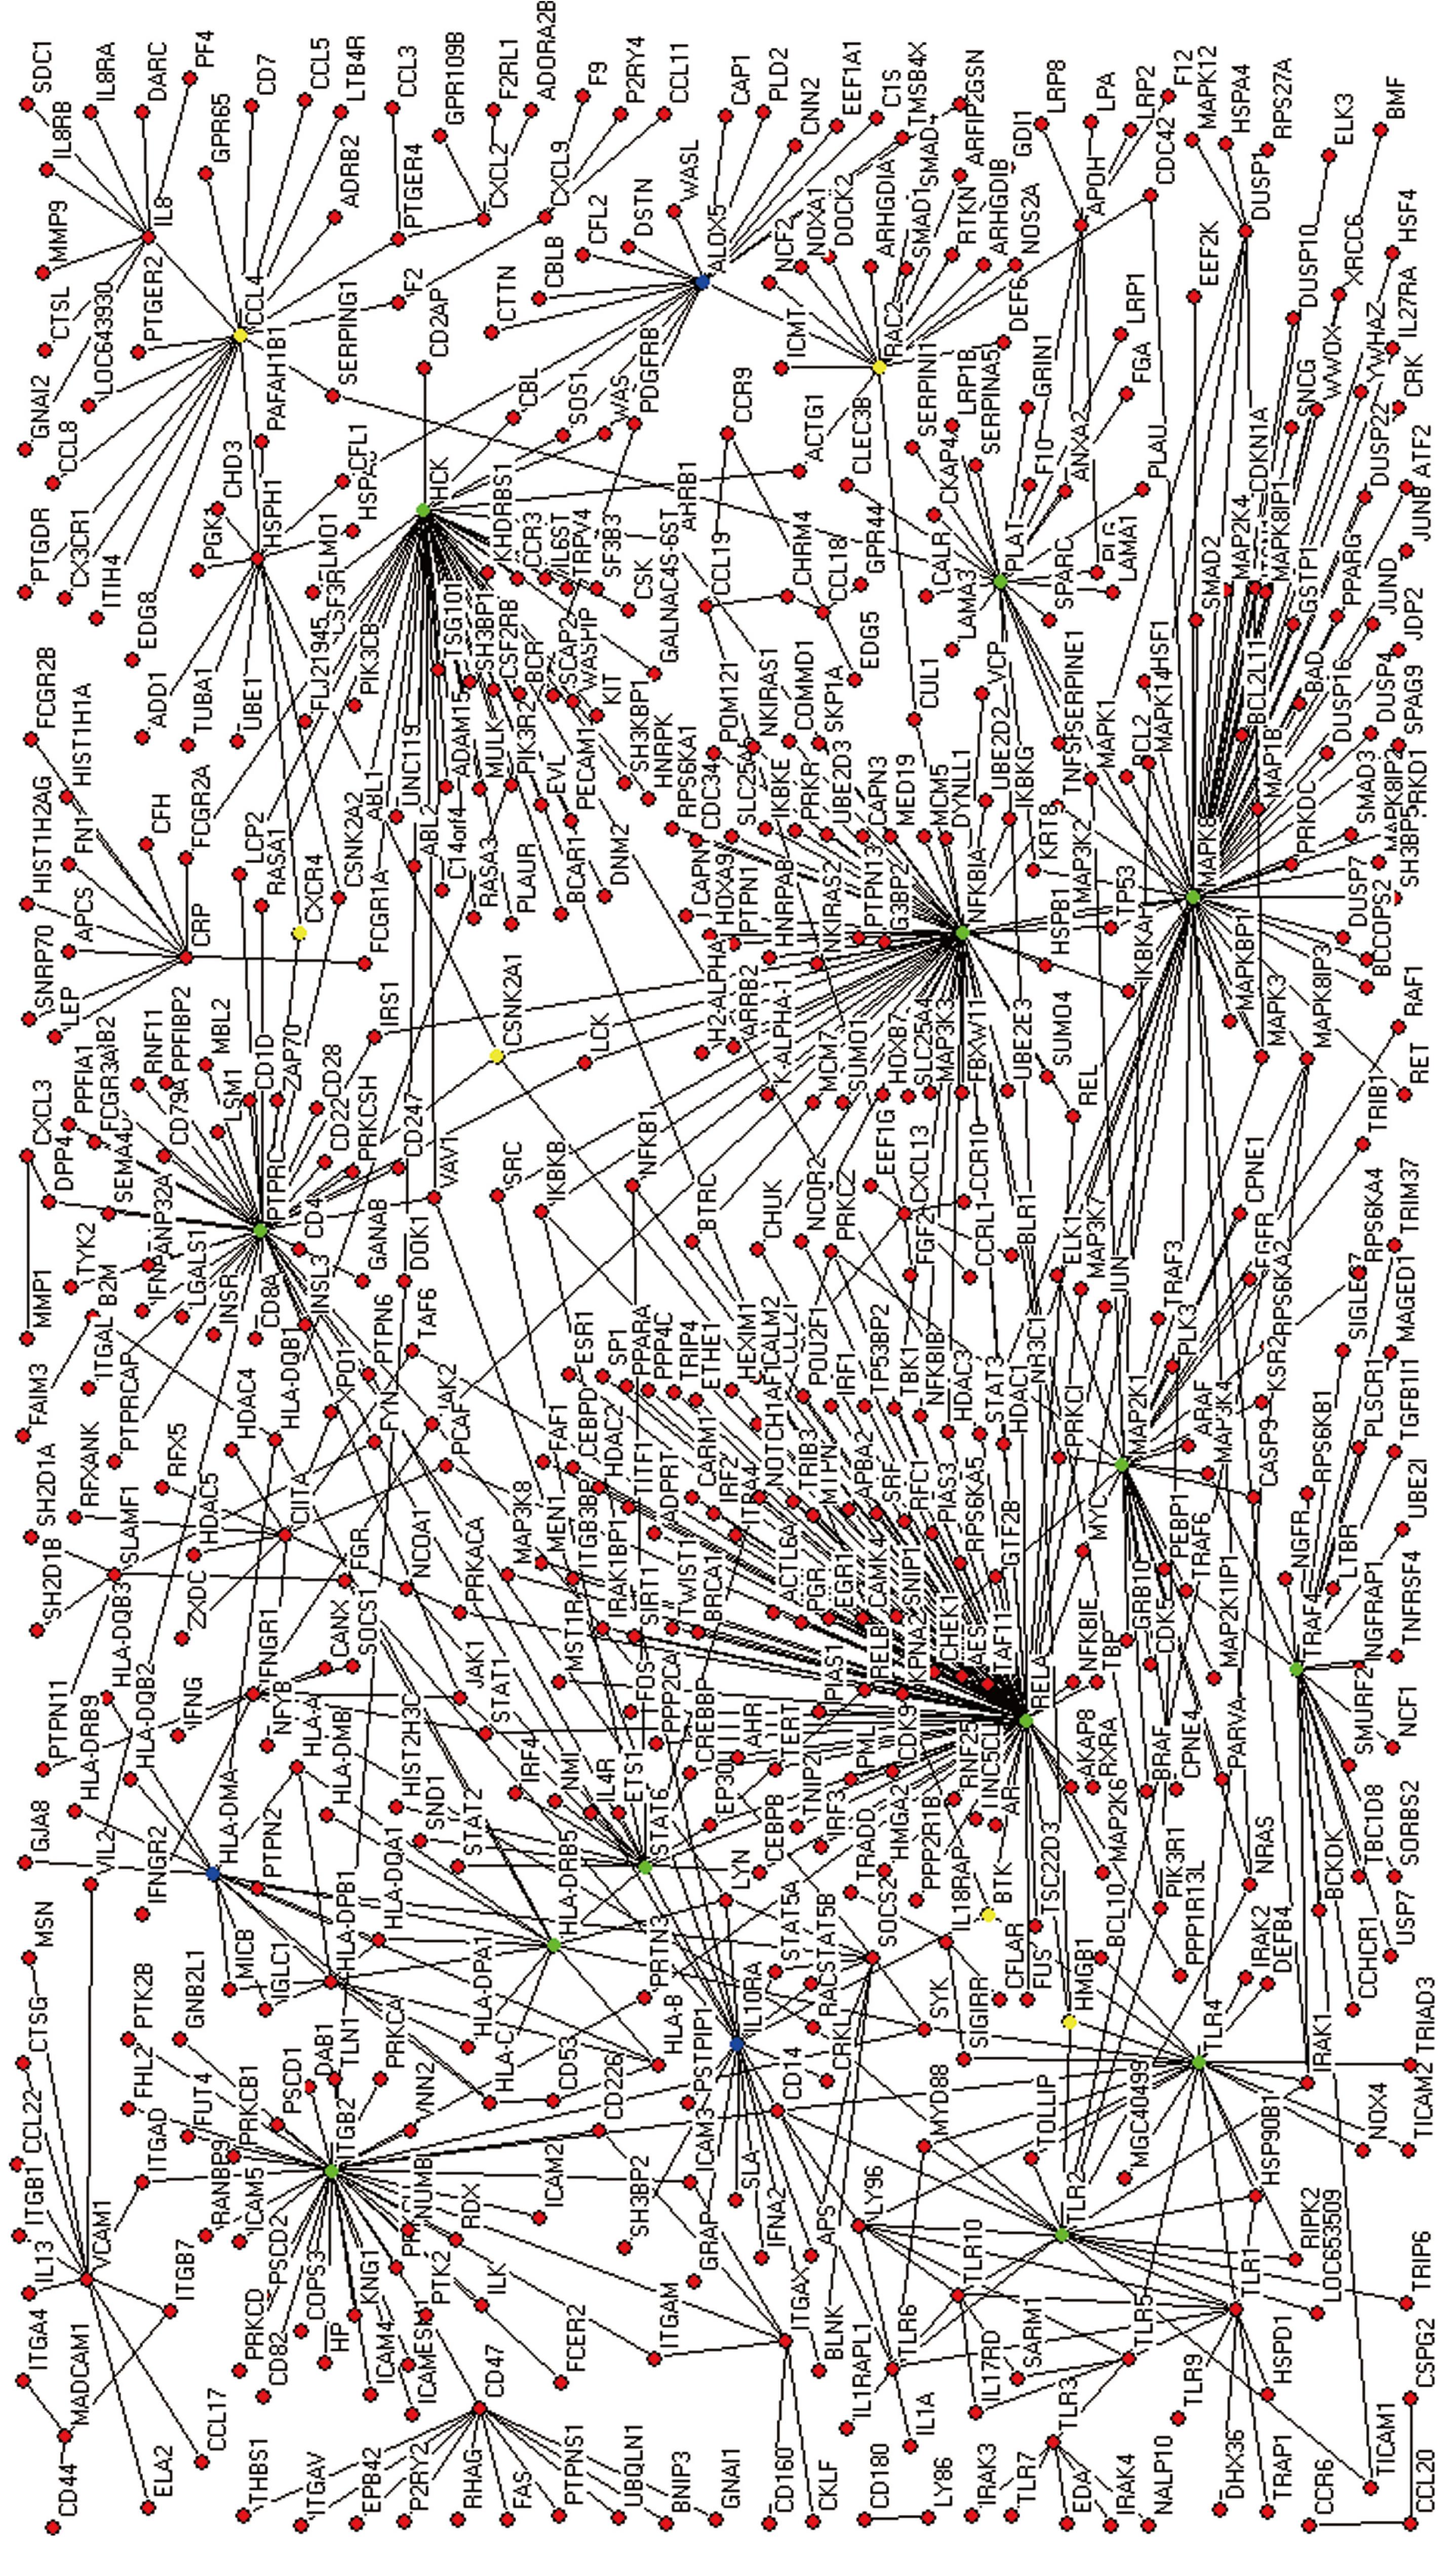
Figure 2 The extended protein interaction network of a cell infected by H pylori.
Green nodes (a large BC and degree), blue nodes (only a large degree), yellow nodes (only a large BC).
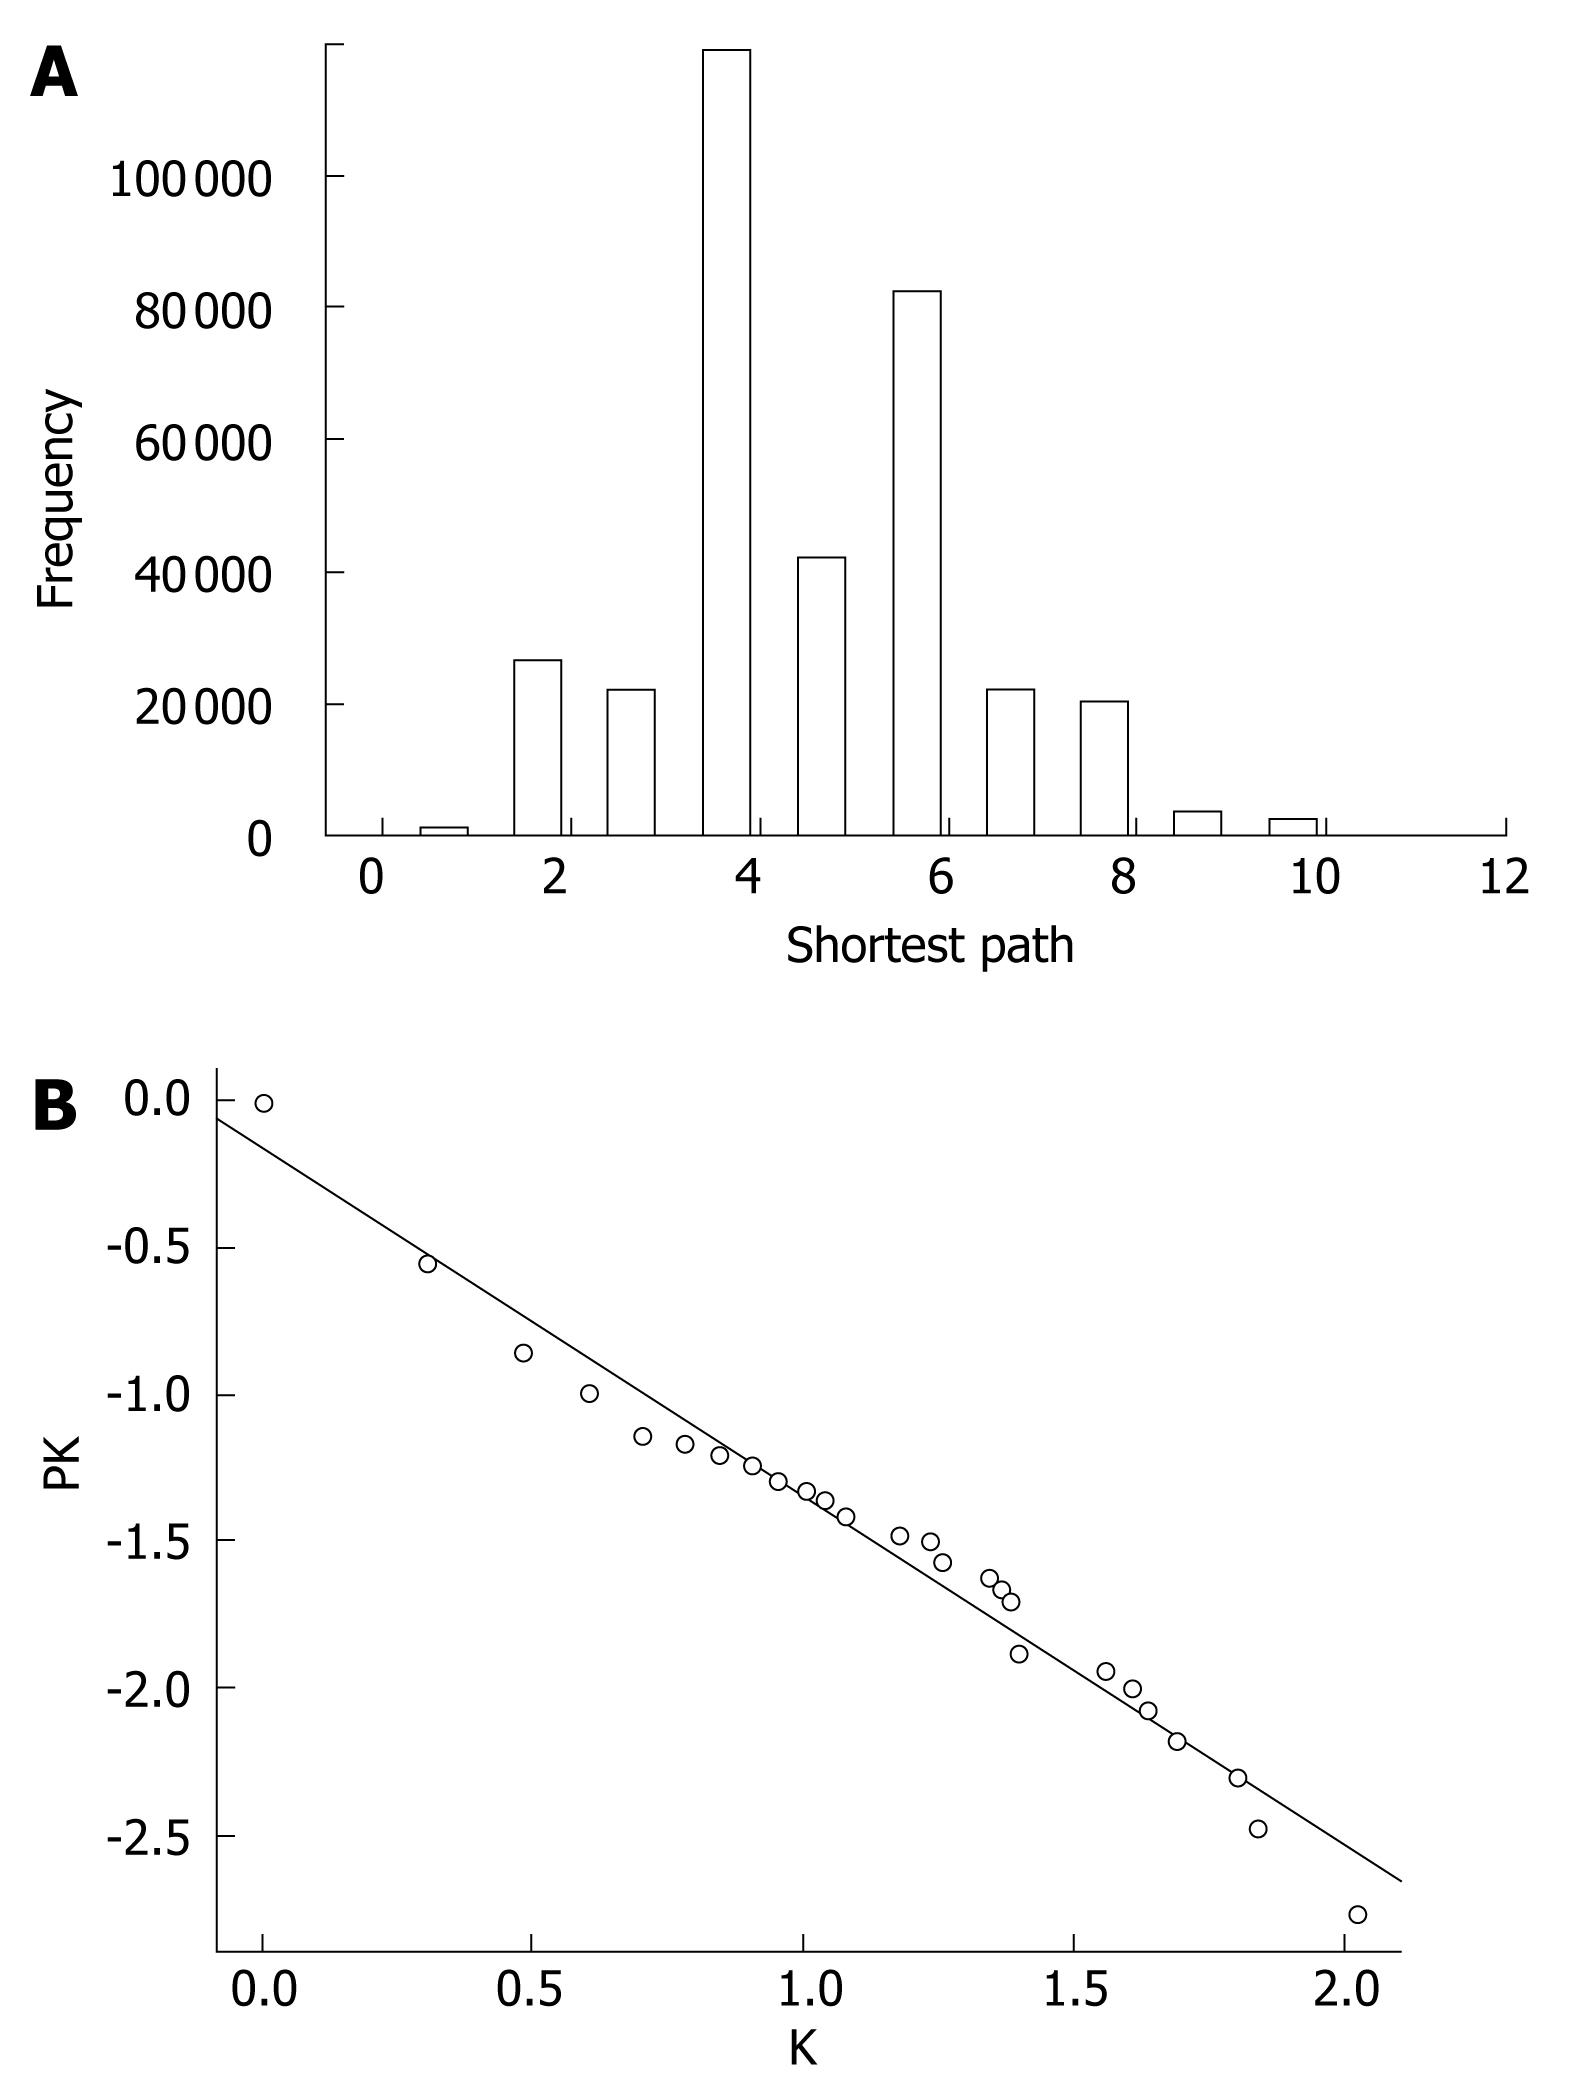
Figure 3 Properties of the extended network.
A: Histogram showing distribution of the shortest path. Two randomly selected nodes were connected via 4.9 links; B: Cumulative degree distribution plot of the extended network showing that degree distribution follows the power law. Line indicates the degree exponent of 1.2, which is one lower than the true degree exponent of 2.2.
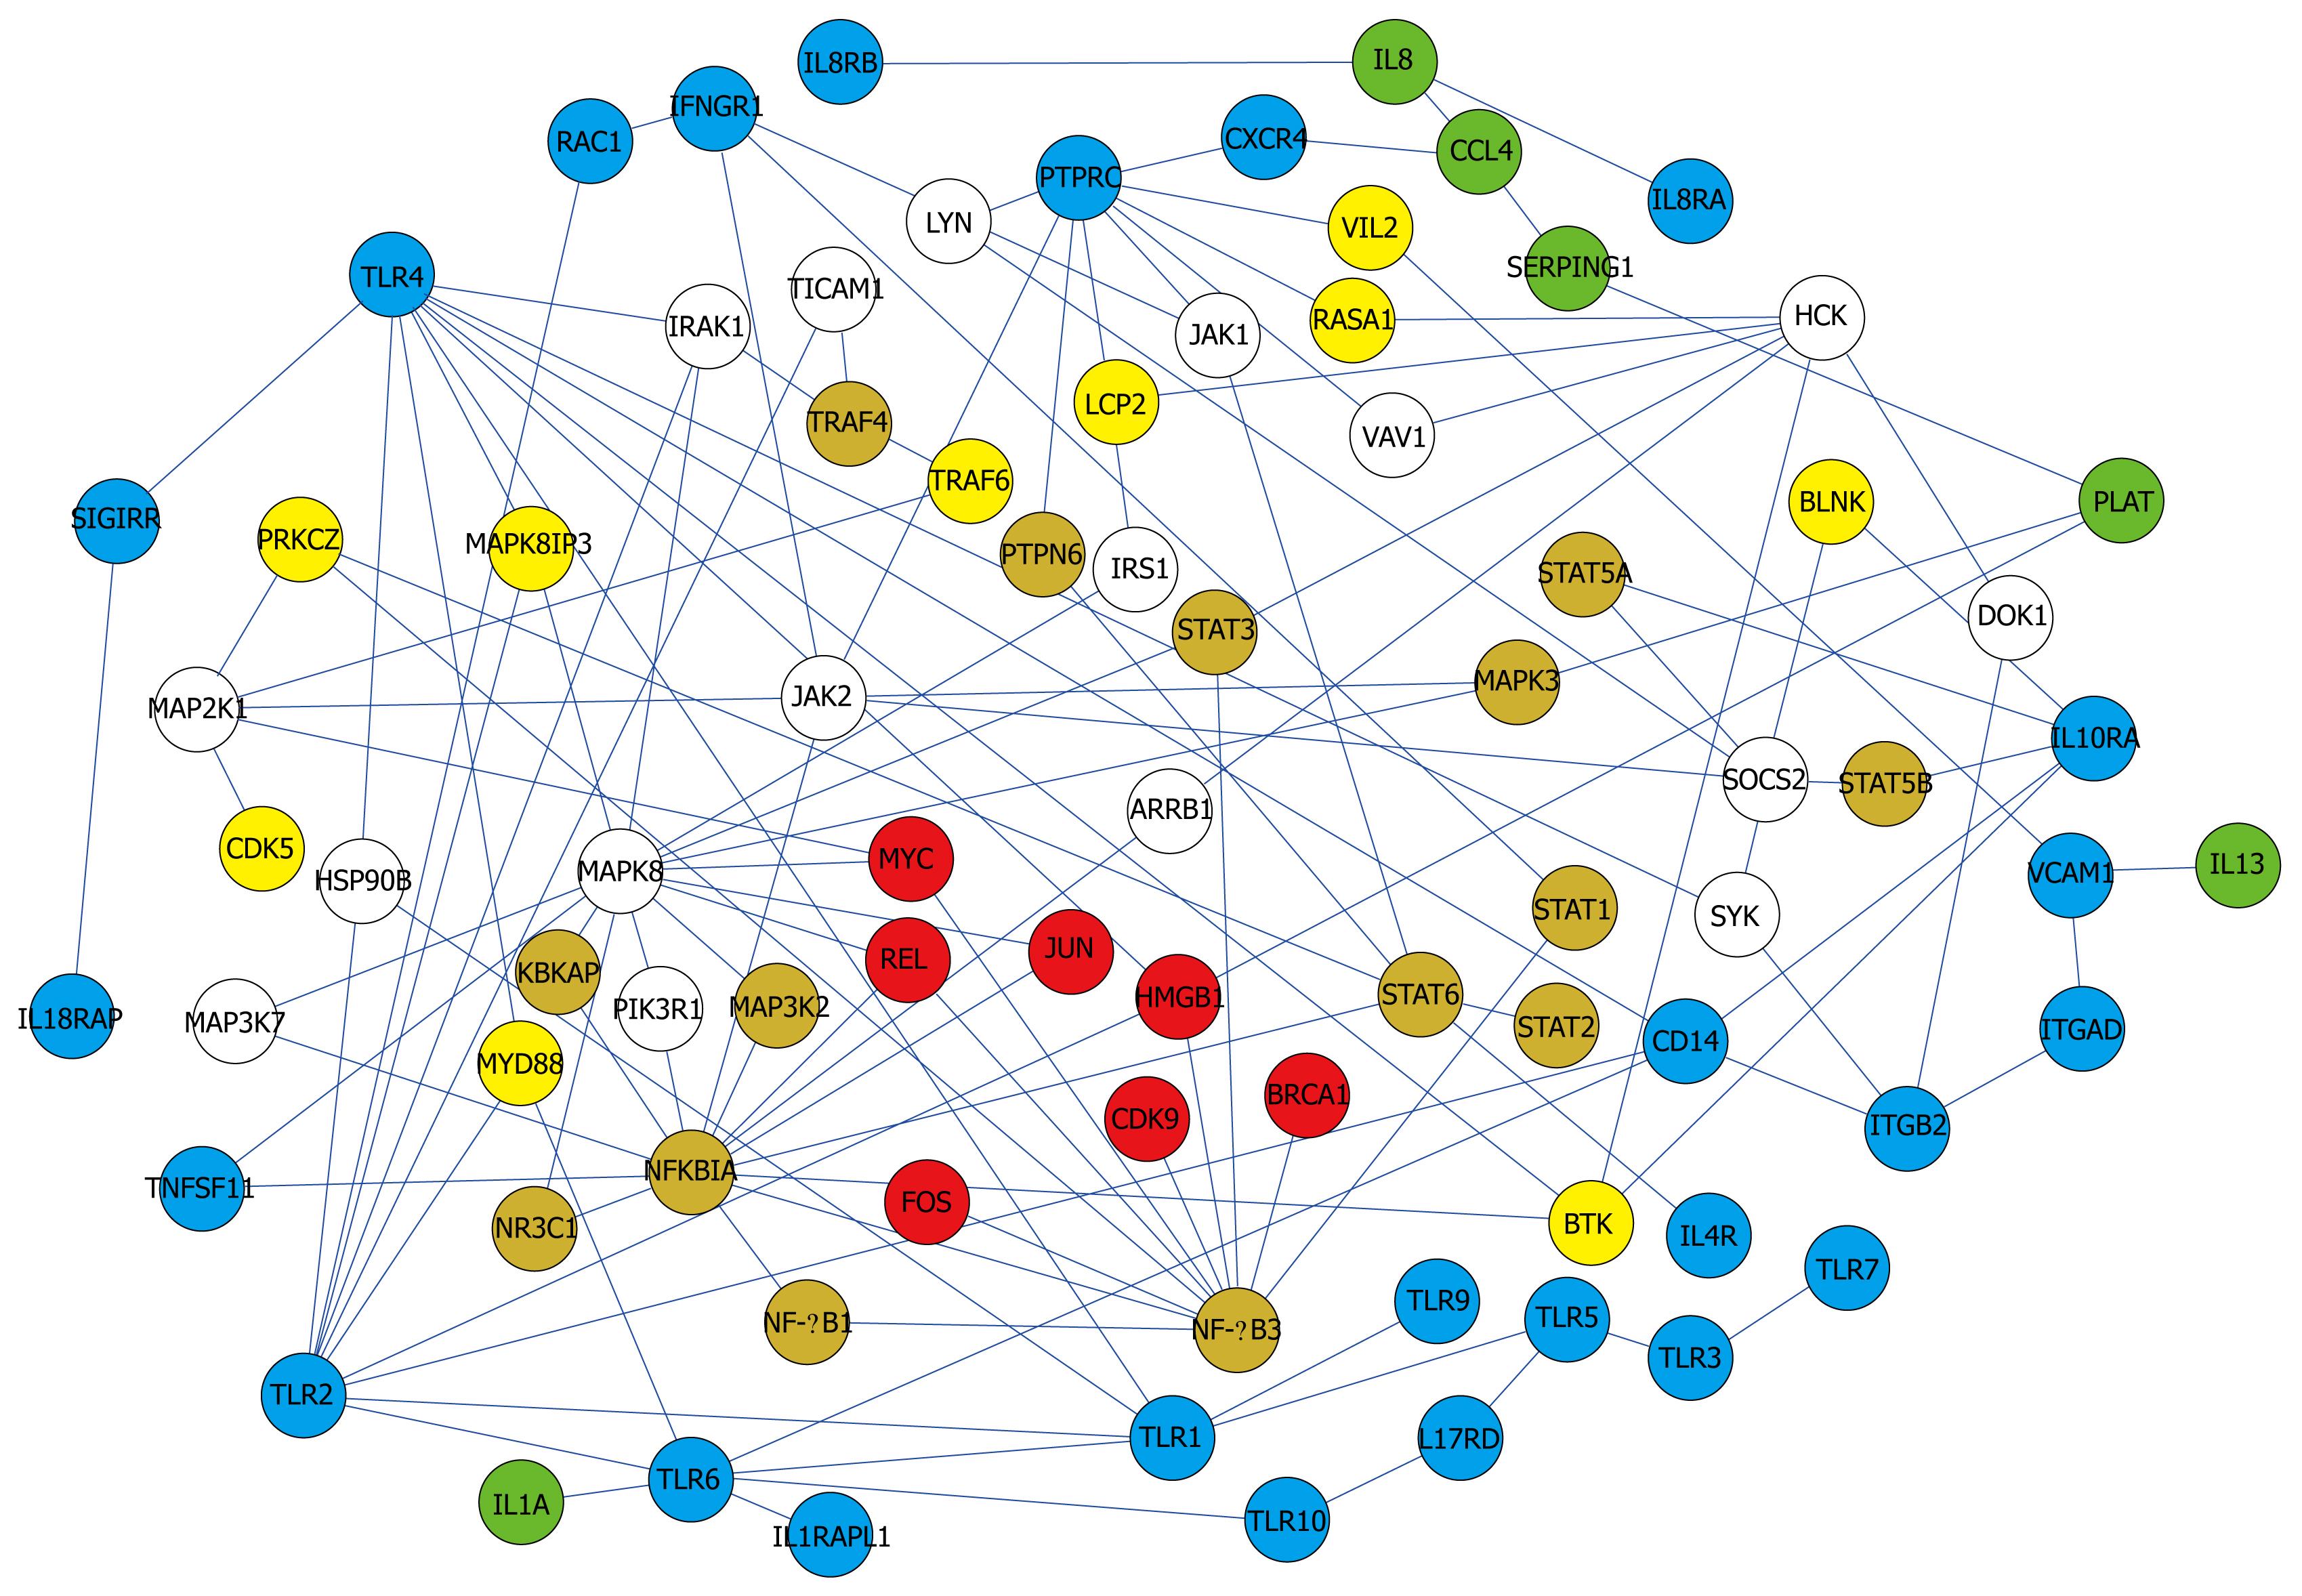
Figure 4 Core network showing simplified interactions and major pathways.
Color of the nodes indicates subcellular location. Red (nucleus), orange (nucleus and cytoplasm), yellow (cytoplasm), blue (membrane), green (extracellular), and white (unknown).
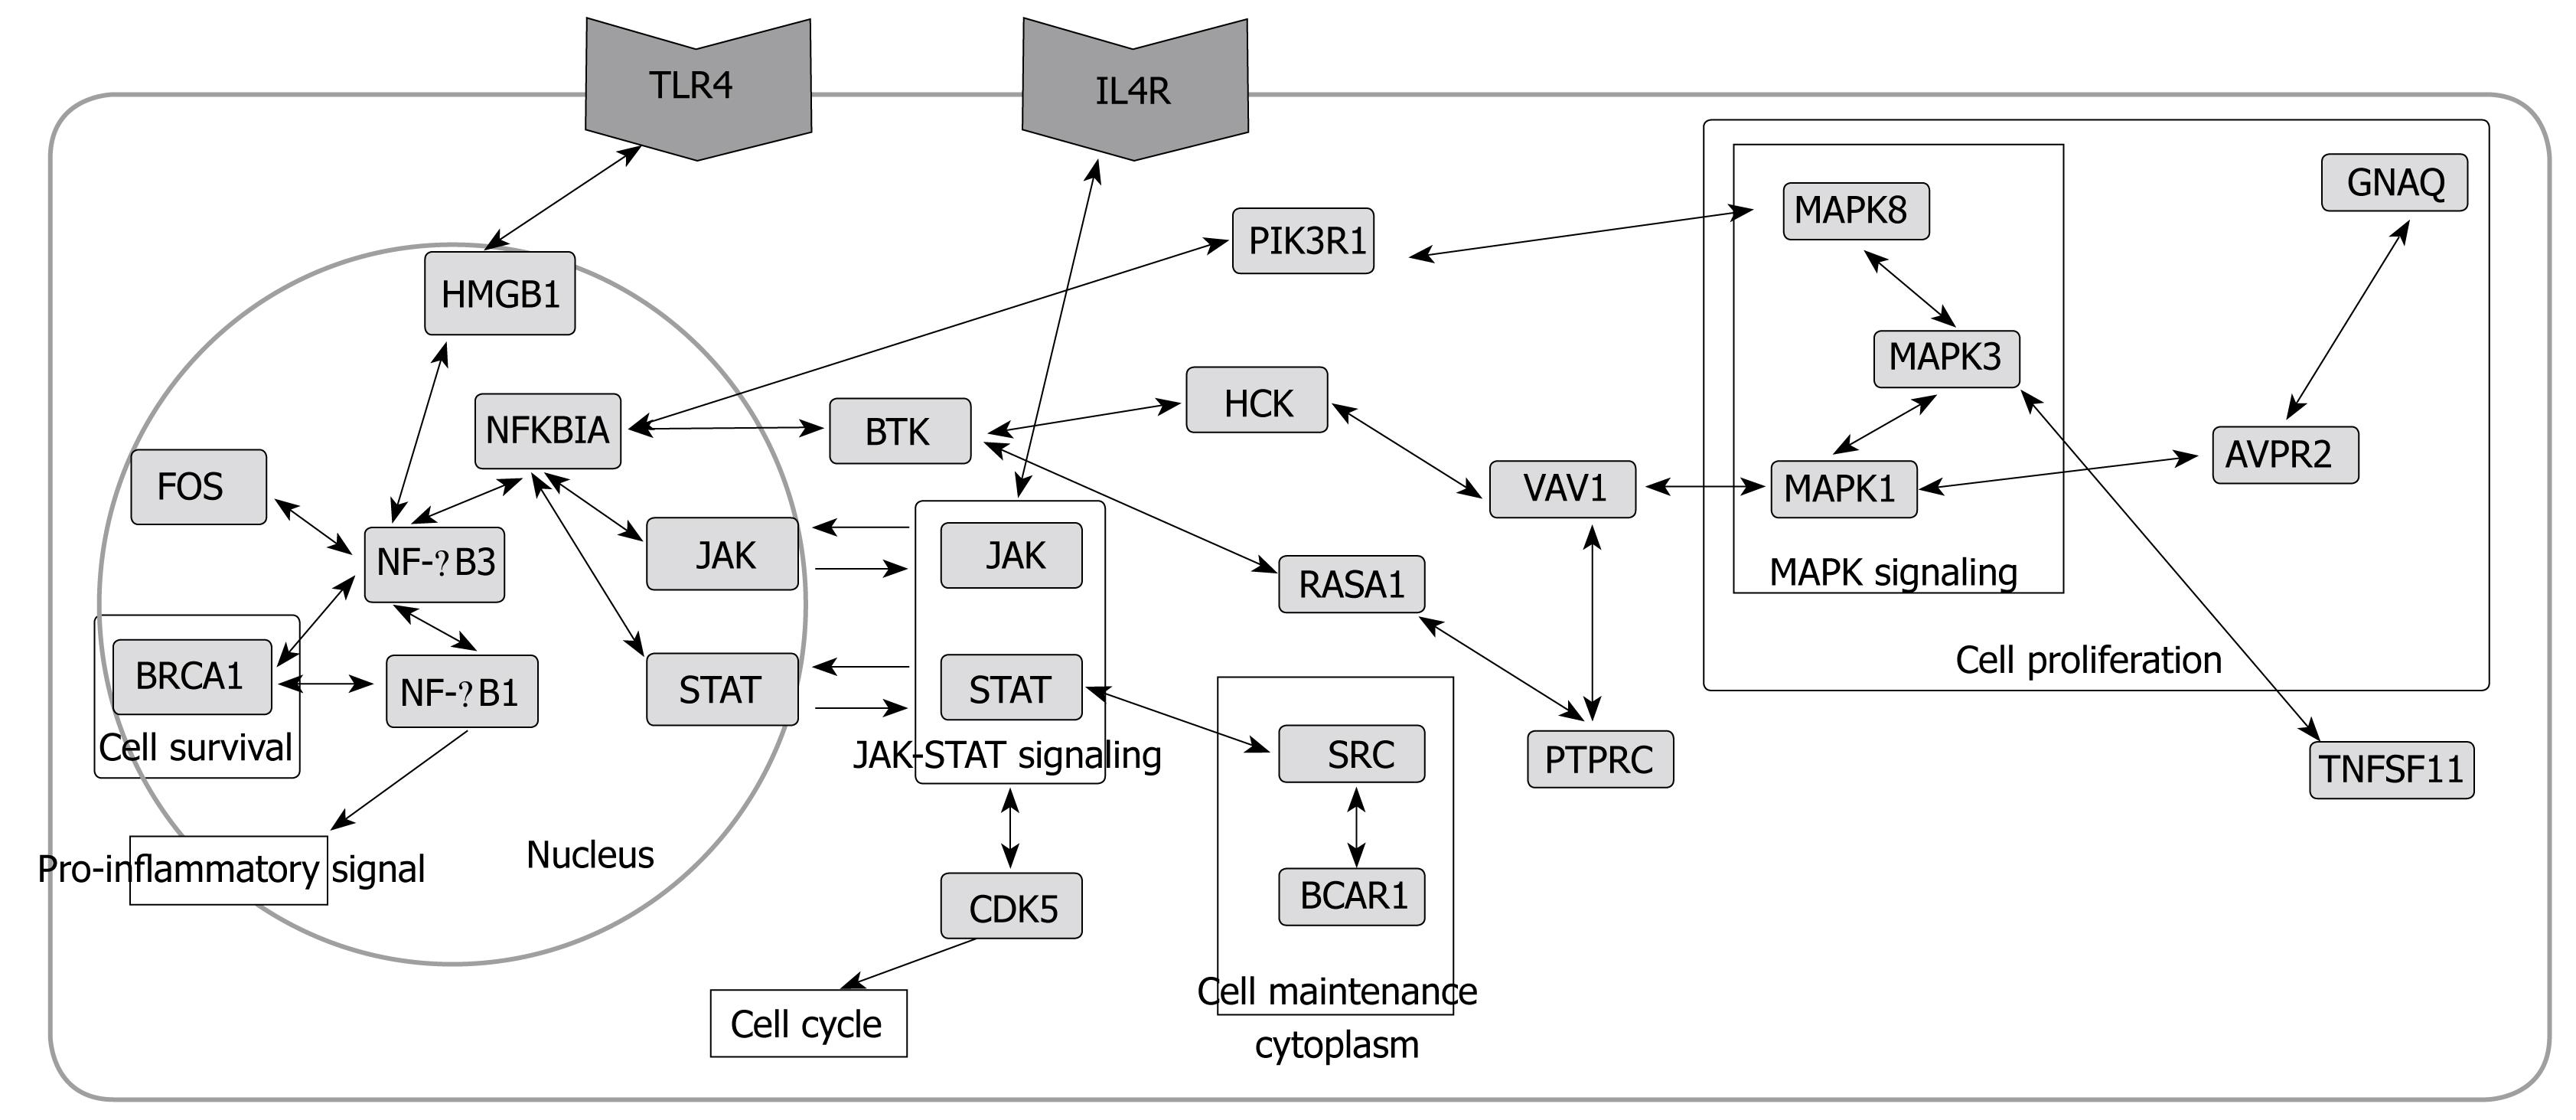
Figure 5 Cell model showing major interactions after H pylori infection.
-
Citation: Kim KK, Kim HB. Protein interaction network related to
Helicobacter pylori infection response. World J Gastroenterol 2009; 15(36): 4518-4528 - URL: https://www.wjgnet.com/1007-9327/full/v15/i36/4518.htm
- DOI: https://dx.doi.org/10.3748/wjg.15.4518


