Copyright
©2009 The WJG Press and Baishideng.
World J Gastroenterol. Sep 28, 2009; 15(36): 4518-4528
Published online Sep 28, 2009. doi: 10.3748/wjg.15.4518
Published online Sep 28, 2009. doi: 10.3748/wjg.15.4518
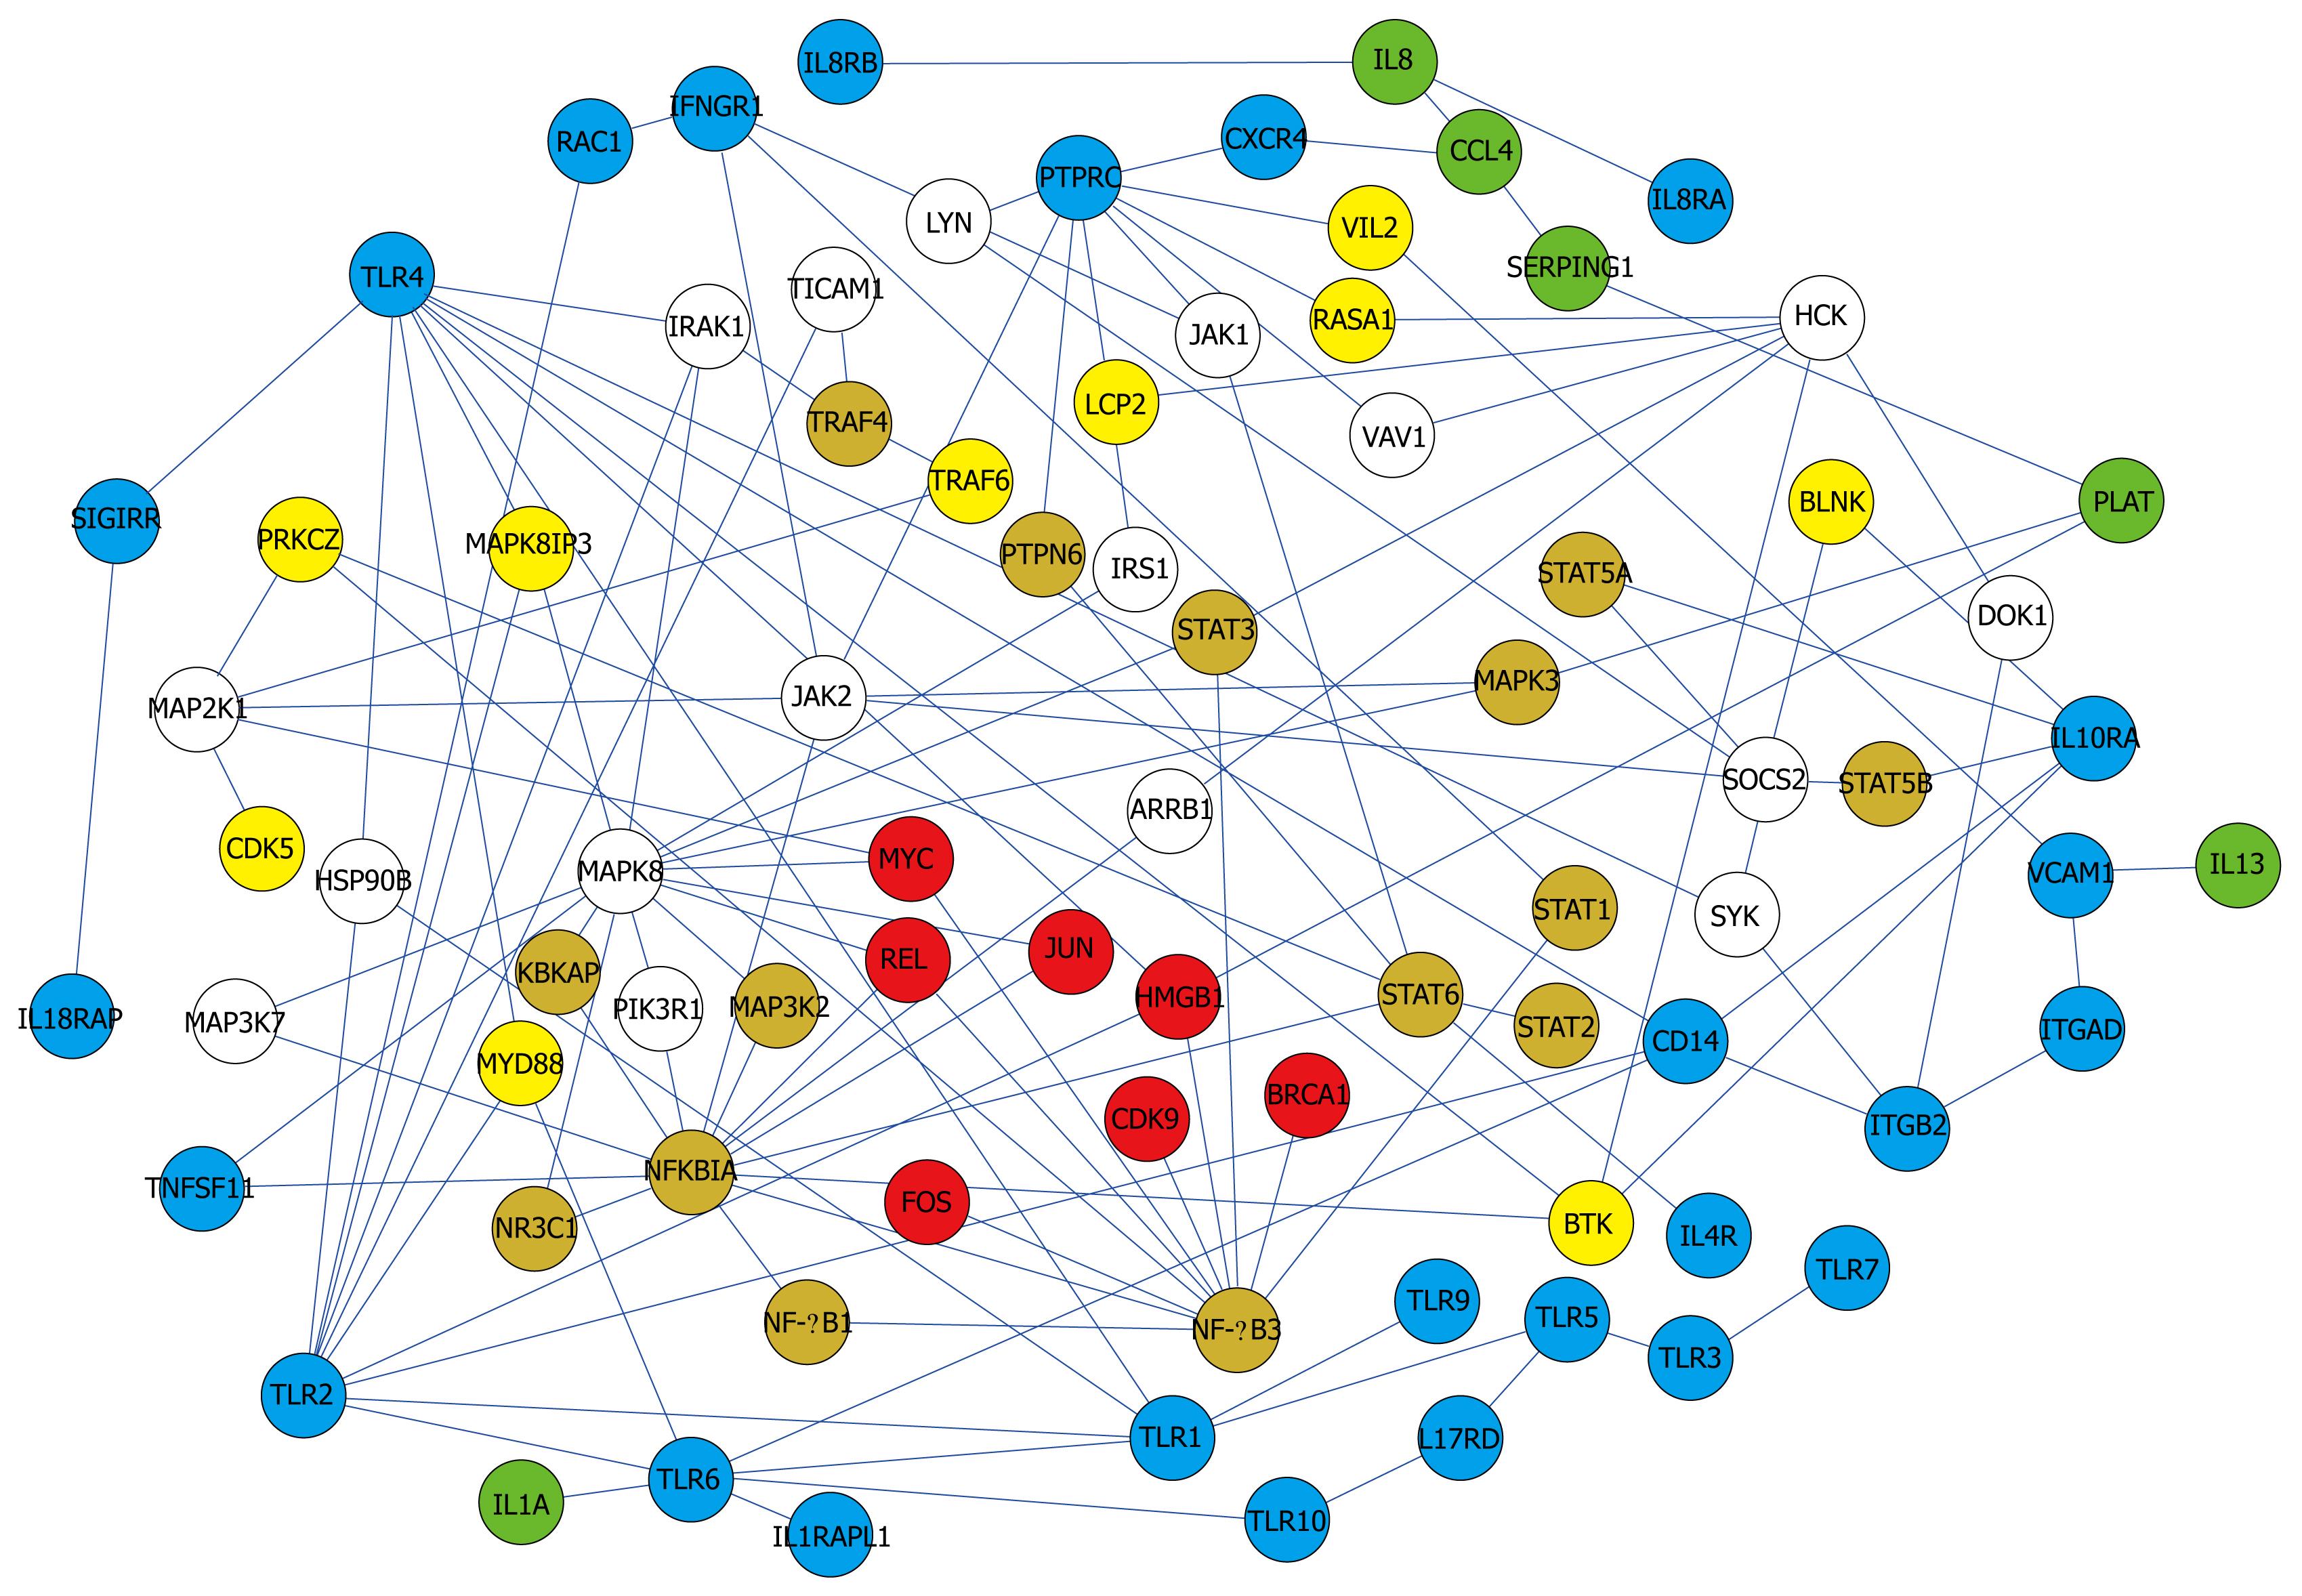
Figure 4 Core network showing simplified interactions and major pathways.
Color of the nodes indicates subcellular location. Red (nucleus), orange (nucleus and cytoplasm), yellow (cytoplasm), blue (membrane), green (extracellular), and white (unknown).
-
Citation: Kim KK, Kim HB. Protein interaction network related to
Helicobacter pylori infection response. World J Gastroenterol 2009; 15(36): 4518-4528 - URL: https://www.wjgnet.com/1007-9327/full/v15/i36/4518.htm
- DOI: https://dx.doi.org/10.3748/wjg.15.4518


