Copyright
©2009 The WJG Press and Baishideng.
World J Gastroenterol. Jul 14, 2009; 15(26): 3246-3253
Published online Jul 14, 2009. doi: 10.3748/wjg.15.3246
Published online Jul 14, 2009. doi: 10.3748/wjg.15.3246
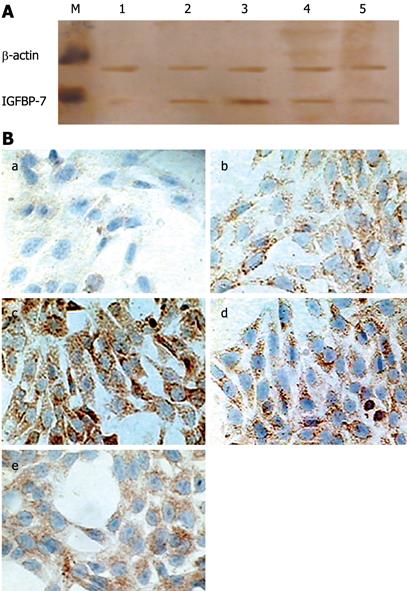
Figure 1 In vitro expression of IGFBP-7 in HSC.
A: Detection of IGFBP-7 by Western blotting. Cultured HSC were incubated with TGF-β1; lysates were harvested after 24 h, and analyzed by Western blotting for IGFBP-7. β-actin was managed as a loading control. Each experiment was replicated 6 times. M: Marker; 1: Control group; 2, 3, 4, 5 represent 2 &mgr;g/L, 4 &mgr;g/L, 8 &mgr;g/L and 16 &mgr;g/L TGF-β1, respectively; B: Expression of IGFBP-7 in activated HSC. Expression of IGFBP-7 was examined on HSC-coated dishes after treatment with TGF-β1 at different concentrations for 24 h (a-e indicated control, 2 &mgr;g/L, 4 &mgr;g/L, 8 &mgr;g/L and 16 &mgr;g/L TGF-β1, respectively). IGFBP-7 was detected by immunocytochemistry, and the level of the expression of IGFBP-7 was enhanced in a dose-dependent manner to some extent compared with the control group. Original magnification: × 200.
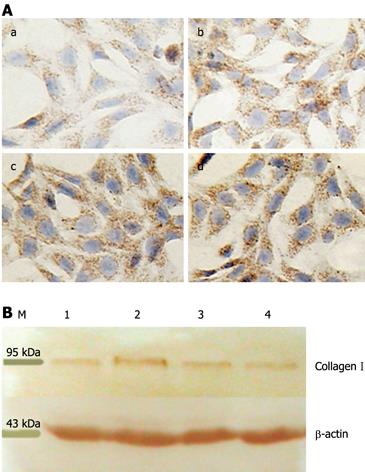
Figure 2 Quantitation of collagen I deposition in HSC.
A: Immunocytochemical detection of collagen I. Expression of collagen I was examined on HSC-coated dishes after treatment with IGFBP-7 at different concentrations for 24 h (a-d indicated control, 10 &mgr;g/L, 20 &mgr;g/L, and 30 &mgr;g/L IGFBP-7, respectively). Collagen I was examined by immunocytochemistry and the level of the expression of collagen I was enhanced in a dose-dependent manner in sequence compared with the control group. Original magnification: × 200; B: Detection of collagen I by Western blotting. Cultured HSC were incubated with IGFBP-7 for 24 h, and then lysates of HSC were harvested and analyzed by Western blotting for collagen I. β-actin was used as a loading control. Each experiment was replicated 6 times. M: Marker; 1: Control group; 2, 3, 4 represent 10 &mgr;g/L, 20 &mgr;g/L, 30 &mgr;g/L.
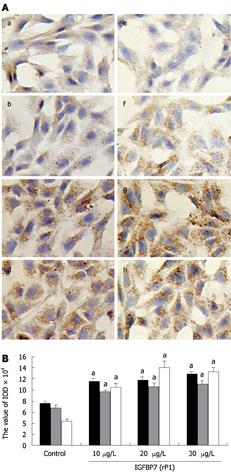
Figure 3 Comparison of fibronectin levels and fibroblast phenotype.
A: Characterization of α-SMA and fibronectin. Immunocytochemistry was performed on HSC after incubation with IGFBP-7 at different concentrations (0, 10 &mgr;g/L, 20 &mgr;g/L and 30 &mgr;g/L) for 24 h. α-SMA (a-e) and fibronectin (f-i) were examined by immunocytochemistry. The amount of the expression of α-SMA (b-d) and fibronectin (f-h) were enhanced in a dose-dependent manner in sequence compared with the control group (a, e). Original magnification: × 200. B: Comparison of the expression of collagen I, fibronectin and α-SMA at different concentrations. The expression of collagen I, fibronectin and α-SMA was detected through immunocytochemistry, and the value of IOD of the positive-brown particles was calculated. The black, gray and white bars represents the IOD value of α-SMA, collagen I and fibronectin, respectively. Statistical analysis was done using the SNK-q test. aP < 0.05.
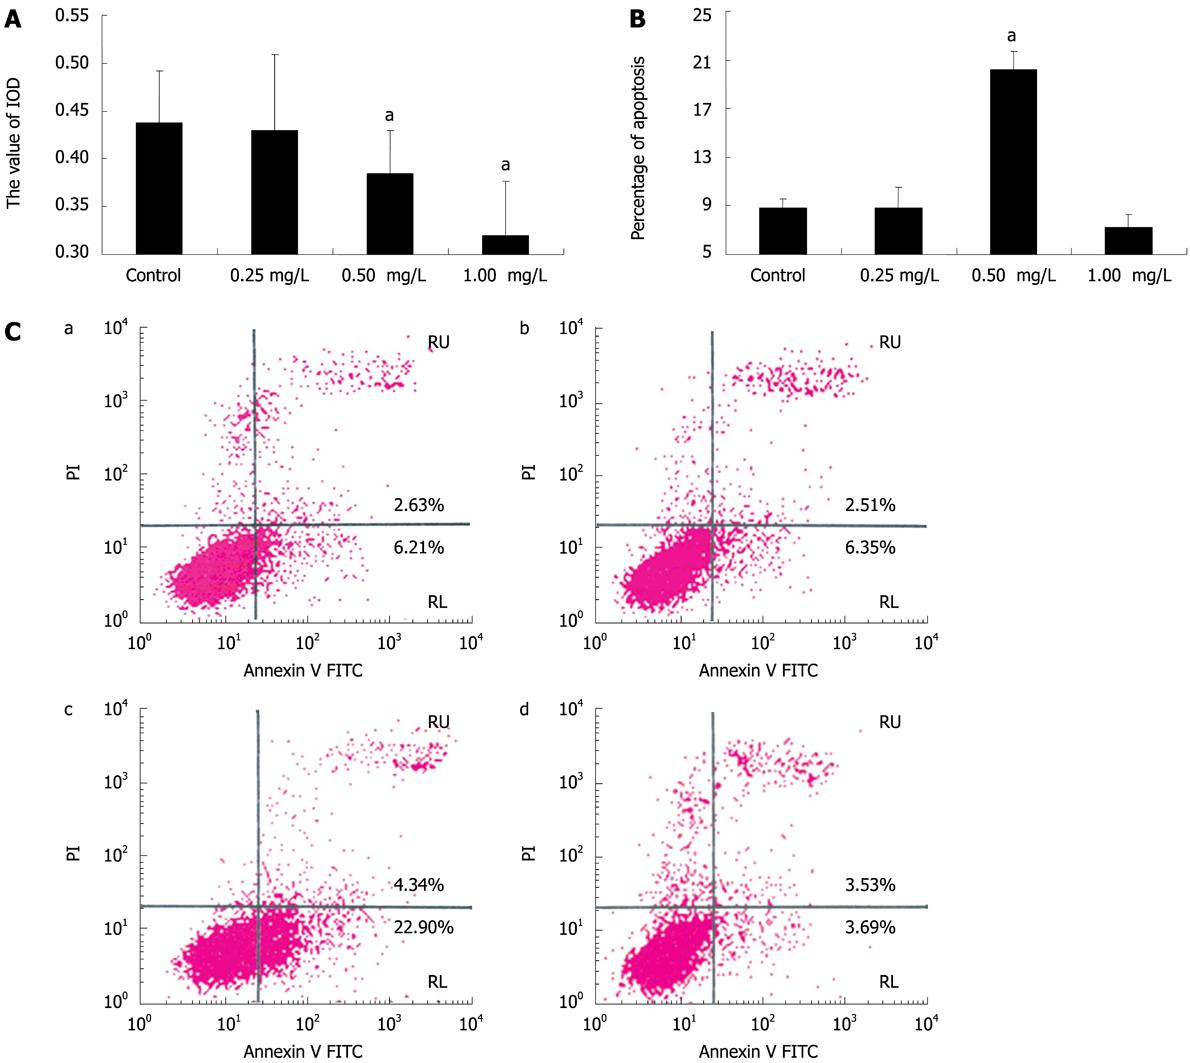
Figure 4 Anti-IGFBP-7 antibody induces HSC apoptosis.
A: HSC viability assay. The activated HSCs had anti-IGFBP-7 antibody of different concentrations added, and the absorbance (A) of each treated group was analyzed by the MTT cell viability assay to investigate the bioactivity of cultured cells. Statistical analysis was done using the SNK-q test. aP < 0.05; B: Percentage of apoptosis in all treated cells. Activated HSCs were divided into 4 groups, and then each group was treated with anti-IGFBP-7 antibody at different concentrations of 0 mg/L, 0.25 mg/L, 0.50 mg/L and 1.0 mg/L, and analyzed after 24 h culture, using flow cytometric assay. Statistical analysis was done using the SNK-q test. aP < 0.05; C: Flow cytometry assay. Cultured cells were treated with anti-IGFBP-7 body at different concentrations of 0 mg/L, 0.25 mg/L, 0.50 mg/L and 1.0 mg/L. After 24 h incubation, flow cytometry was used to analyze the pro-apoptotic effect of anti-IGFBP-7 antibody.
-
Citation: Liu LX, Huang S, Zhang QQ, Liu Y, Zhang DM, Guo XH, Han DW. Insulin-like growth factor binding protein-7 induces activation and transdifferentiation of hepatic stellate cells
in vitro . World J Gastroenterol 2009; 15(26): 3246-3253 - URL: https://www.wjgnet.com/1007-9327/full/v15/i26/3246.htm
- DOI: https://dx.doi.org/10.3748/wjg.15.3246


