Copyright
©2009 The WJG Press and Baishideng.
World J Gastroenterol. Jul 7, 2009; 15(25): 3166-3172
Published online Jul 7, 2009. doi: 10.3748/wjg.15.3166
Published online Jul 7, 2009. doi: 10.3748/wjg.15.3166
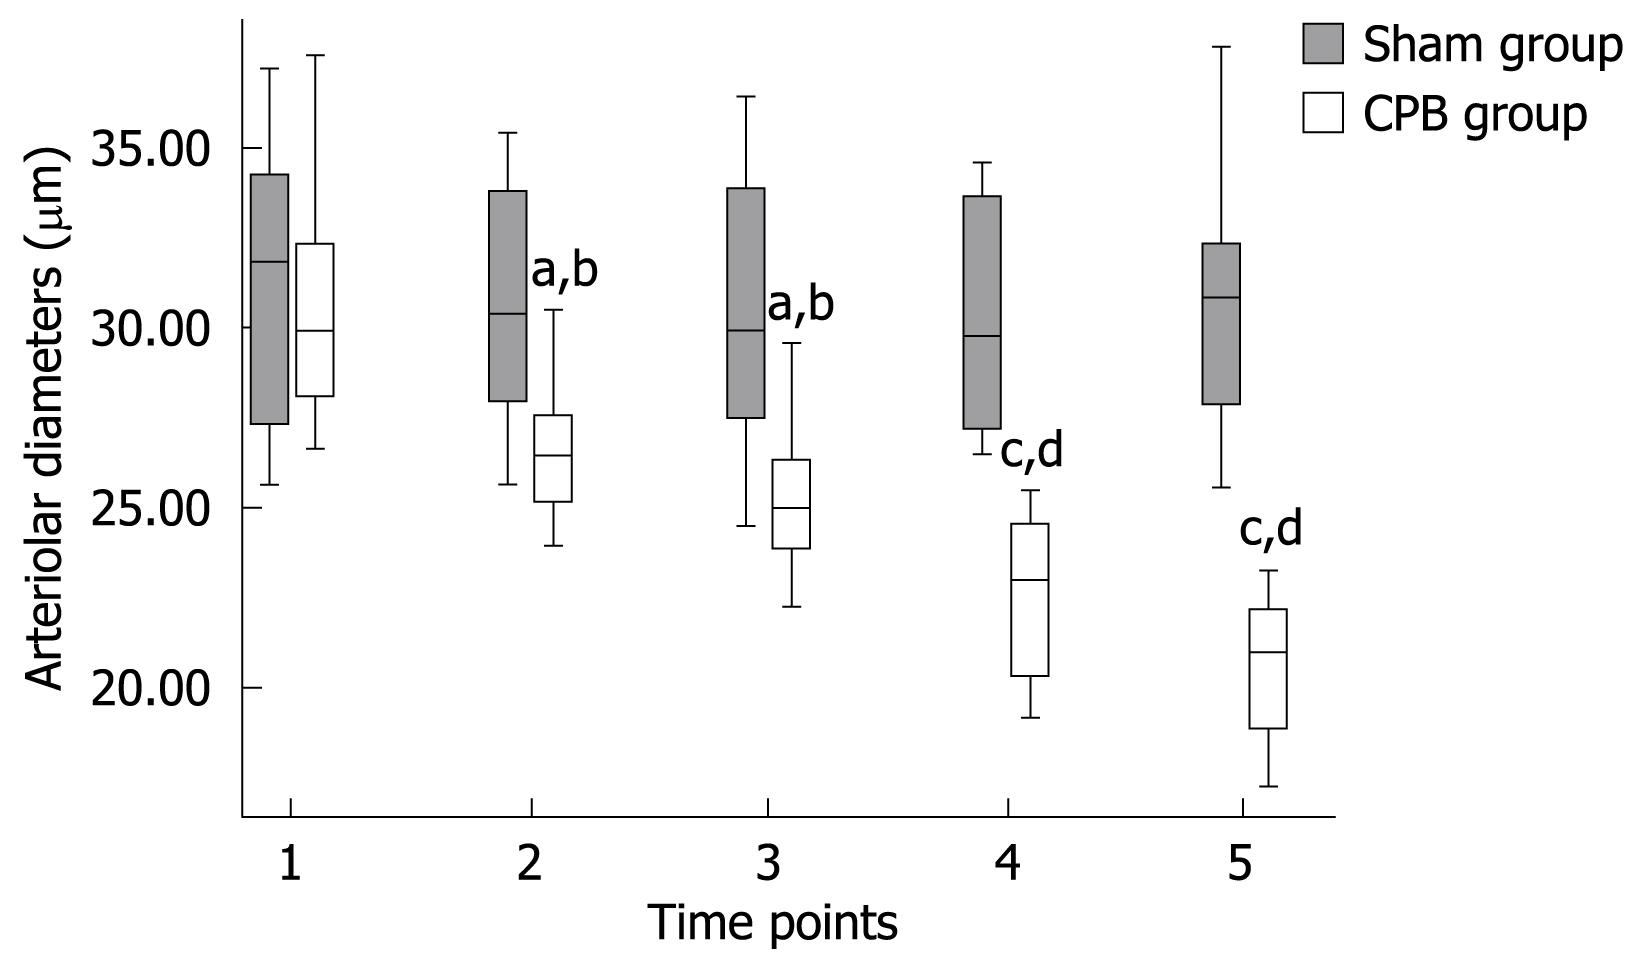
Figure 1 Diameter of arterioles in mucosa.
Values are expressed as mean ± SD, aP < 0.01, cP < 0.001 vs baseline; bP < 0.01, dP < 0.001 vs sham group. Time points: 1: Baseline; 2: 30 min of CPB; 3: 60 min of CPB; 4: 60 min after weaning off CPB; 5: 120 min after weaning off CPB.
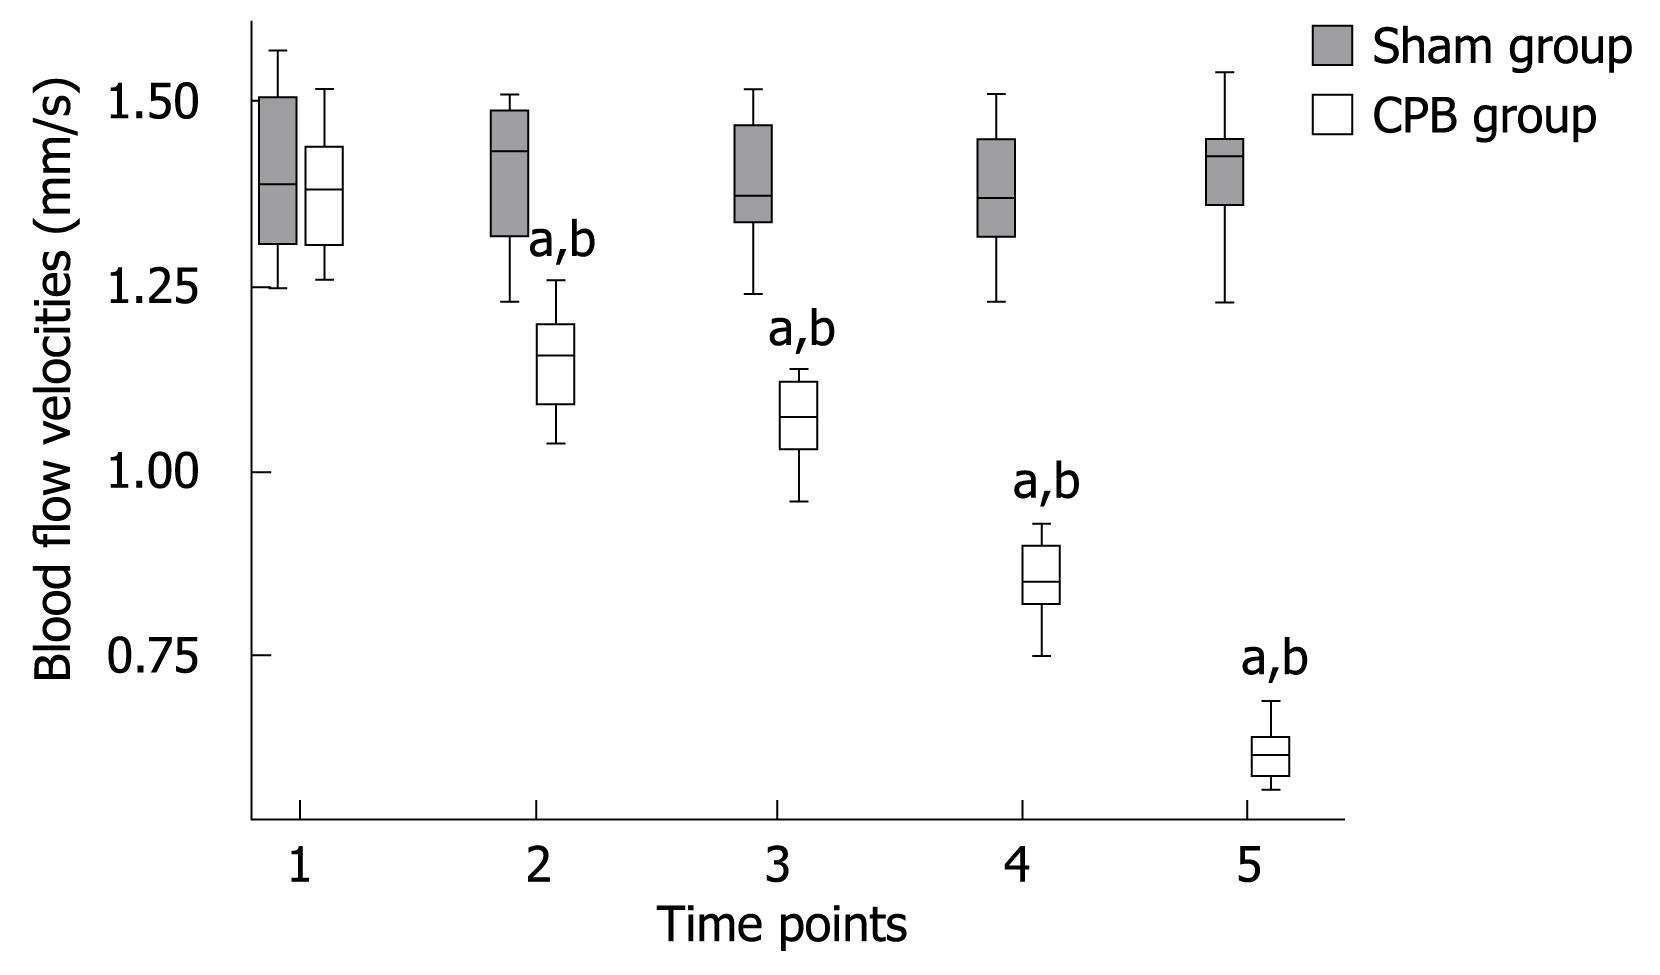
Figure 2 Blood cell velocities in collecting venules in submucosa.
Values are expressed as means ± SD, aP < 0.001 vs baseline; bP < 0.001 vs sham group (Time points: see Figure 1).
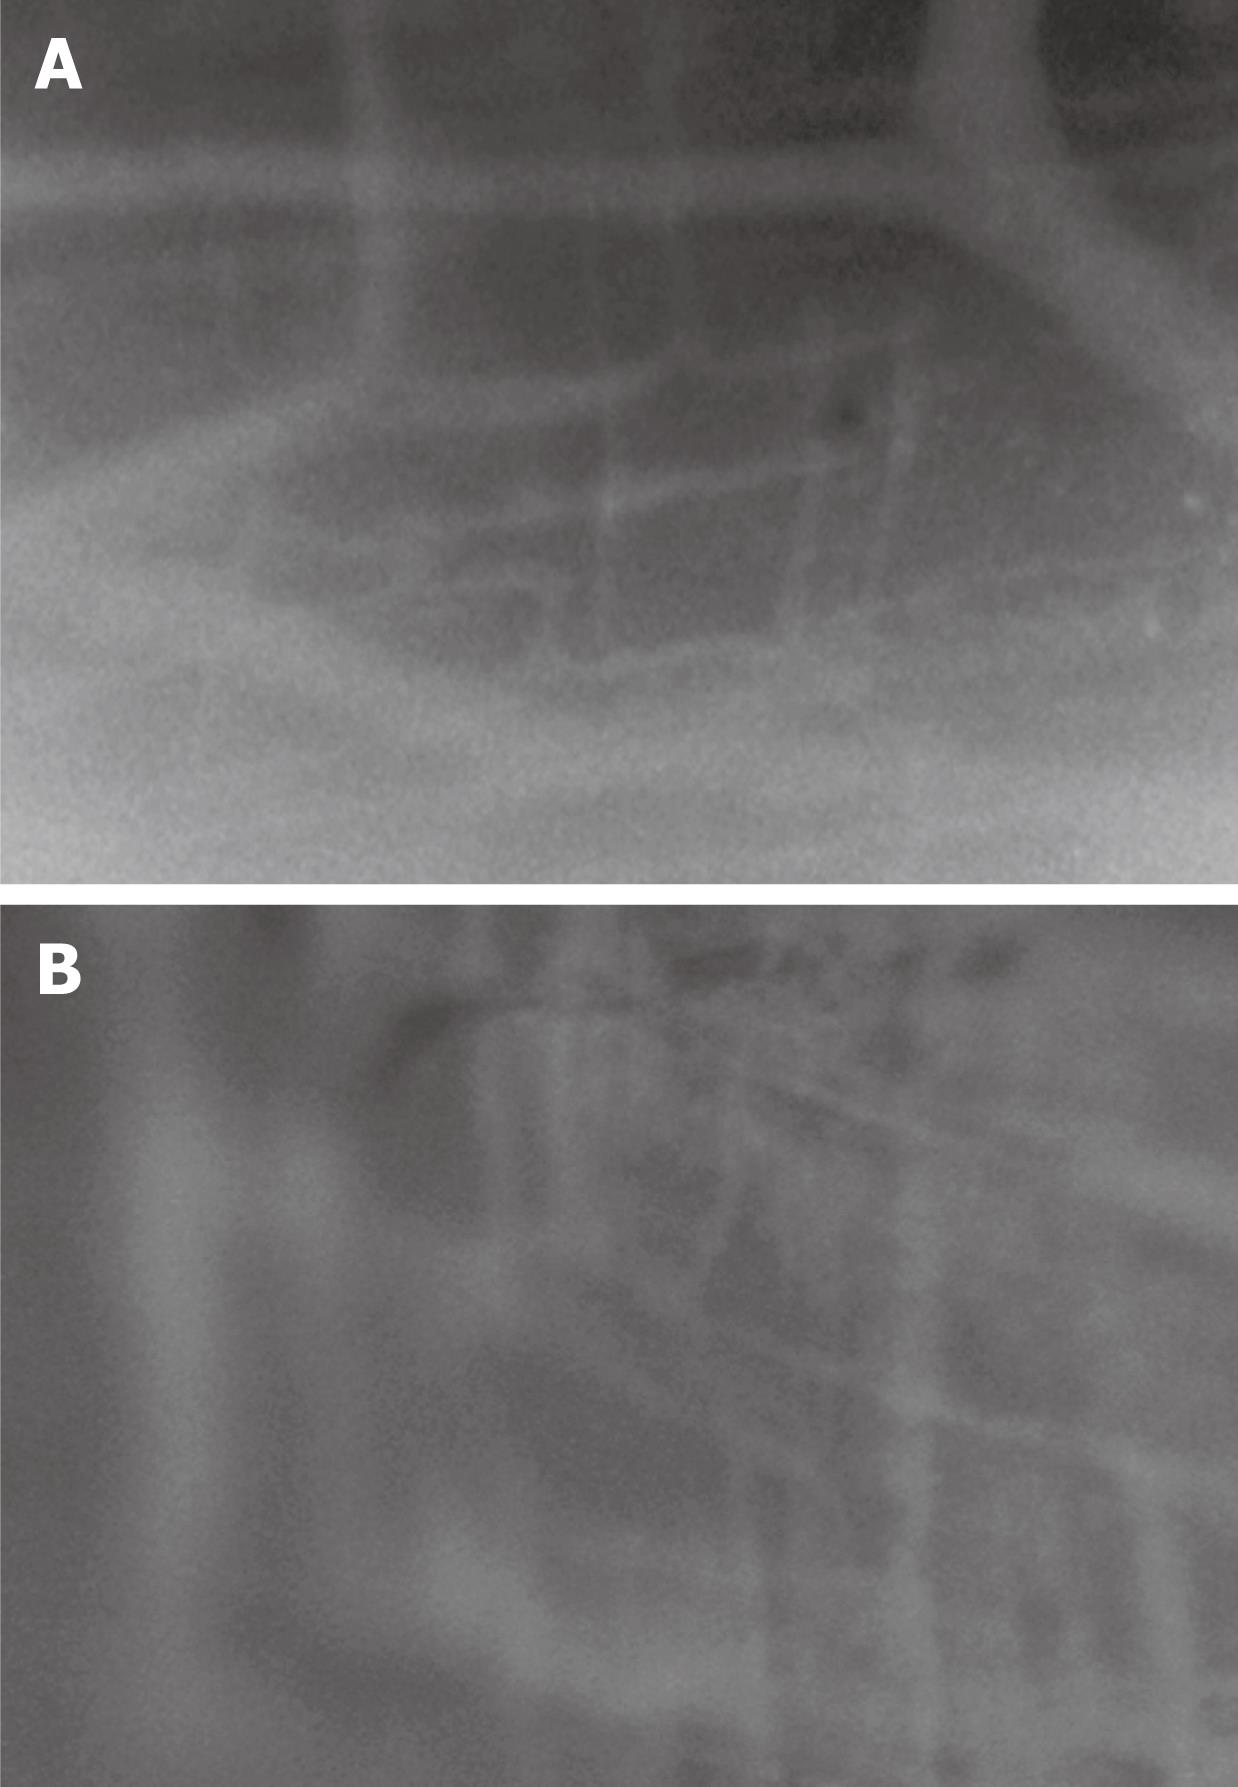
Figure 3 Interstitial fluorescence after administration of FITC-BSA in muscular layer.
A: Control animals. FITC-BSA was contained within the vessels and the capillaries are easily identified; B: CPB animals. FITC-BSA extravasated from the capillaries into the interstitium, and a brighter flare surrounded the microvasculature (Magnification, × 650).
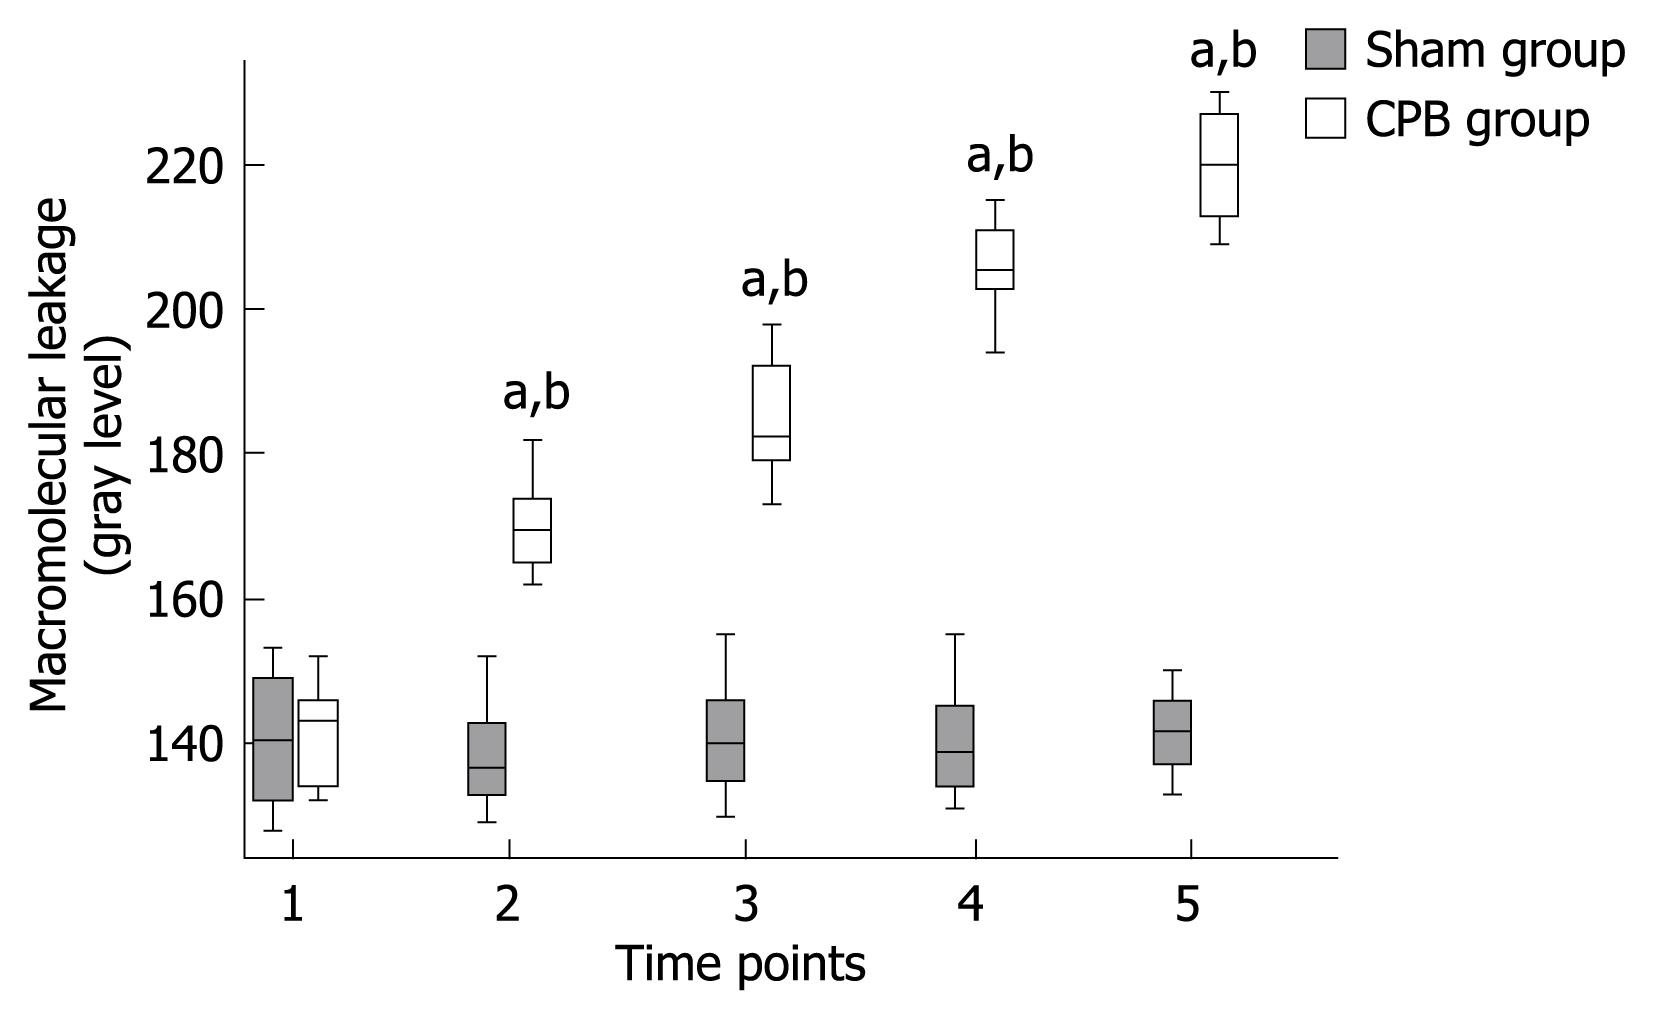
Figure 4 Macromolecular leakage of intestinal microcirculation in muscular layer.
FITC-BSA leakage was represented as the gray level of Intestinal fluorescent intensity. Values are expressed as means ± SD, aP < 0.001 vs baseline; bP < 0.001 vs sham group (Time points: see Figure 1).
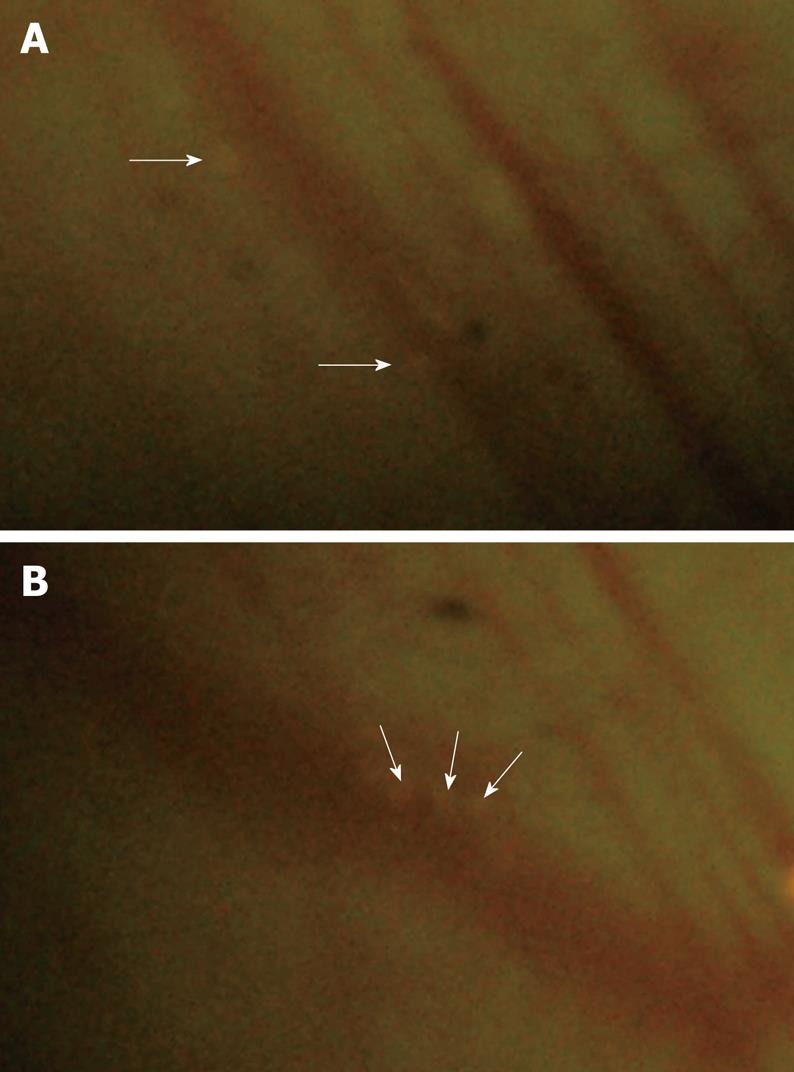
Figure 5 Leukocyte adhesion in intestinal submucosa.
A: Control animals. Few adherent leukocytes (arrows) were observed within the microcirculation; B: CPB animals. Numerous adherent leukocytes (arrows) were observed within the capillaries.
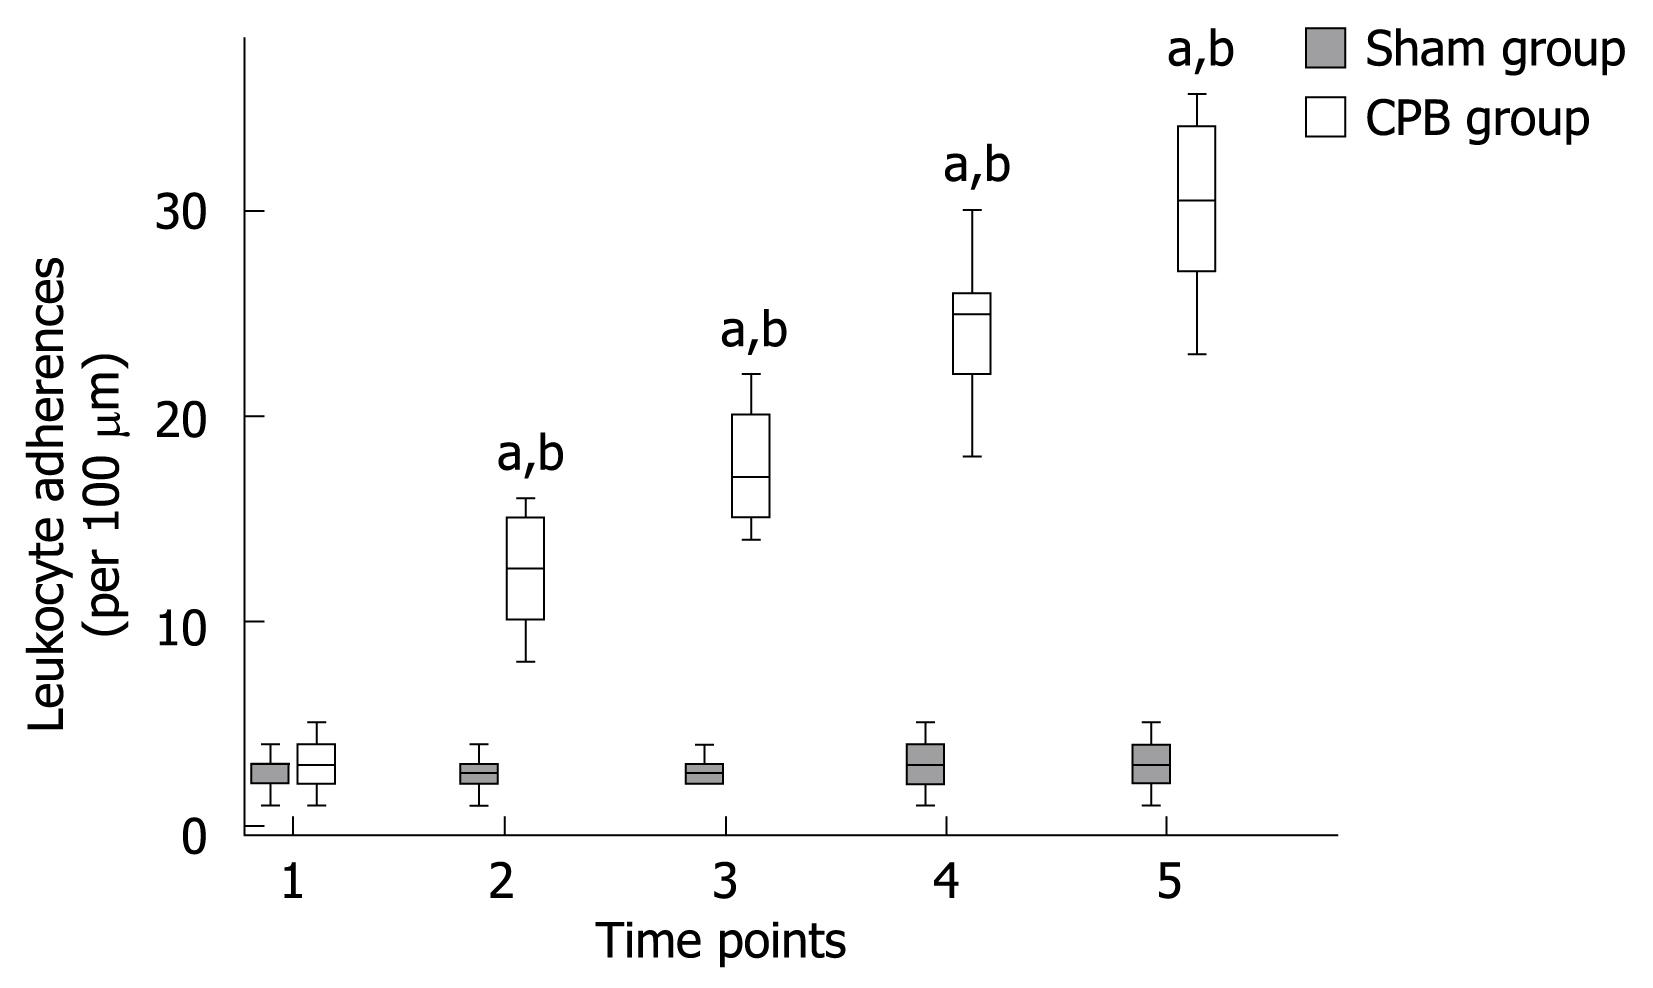
Figure 6 Quantitative analysis of leukocyte adhesion in intestinal submucosa.
Adherent leukocytes per 100 &mgr;m length of venule. Values are expressed as means ± SD, aP < 0.001 vs baseline; bP < 0.001 vs sham group (Time points: see Figure 1).
- Citation: Dong GH, Wang CT, Li Y, Xu B, Qian JJ, Wu HW, Jing H. Cardiopulmonary bypass induced microcirculatory injury of the small bowel in rats. World J Gastroenterol 2009; 15(25): 3166-3172
- URL: https://www.wjgnet.com/1007-9327/full/v15/i25/3166.htm
- DOI: https://dx.doi.org/10.3748/wjg.15.3166


