Copyright
©2009 The WJG Press and Baishideng.
World J Gastroenterol. Jul 7, 2009; 15(25): 3134-3141
Published online Jul 7, 2009. doi: 10.3748/wjg.15.3134
Published online Jul 7, 2009. doi: 10.3748/wjg.15.3134
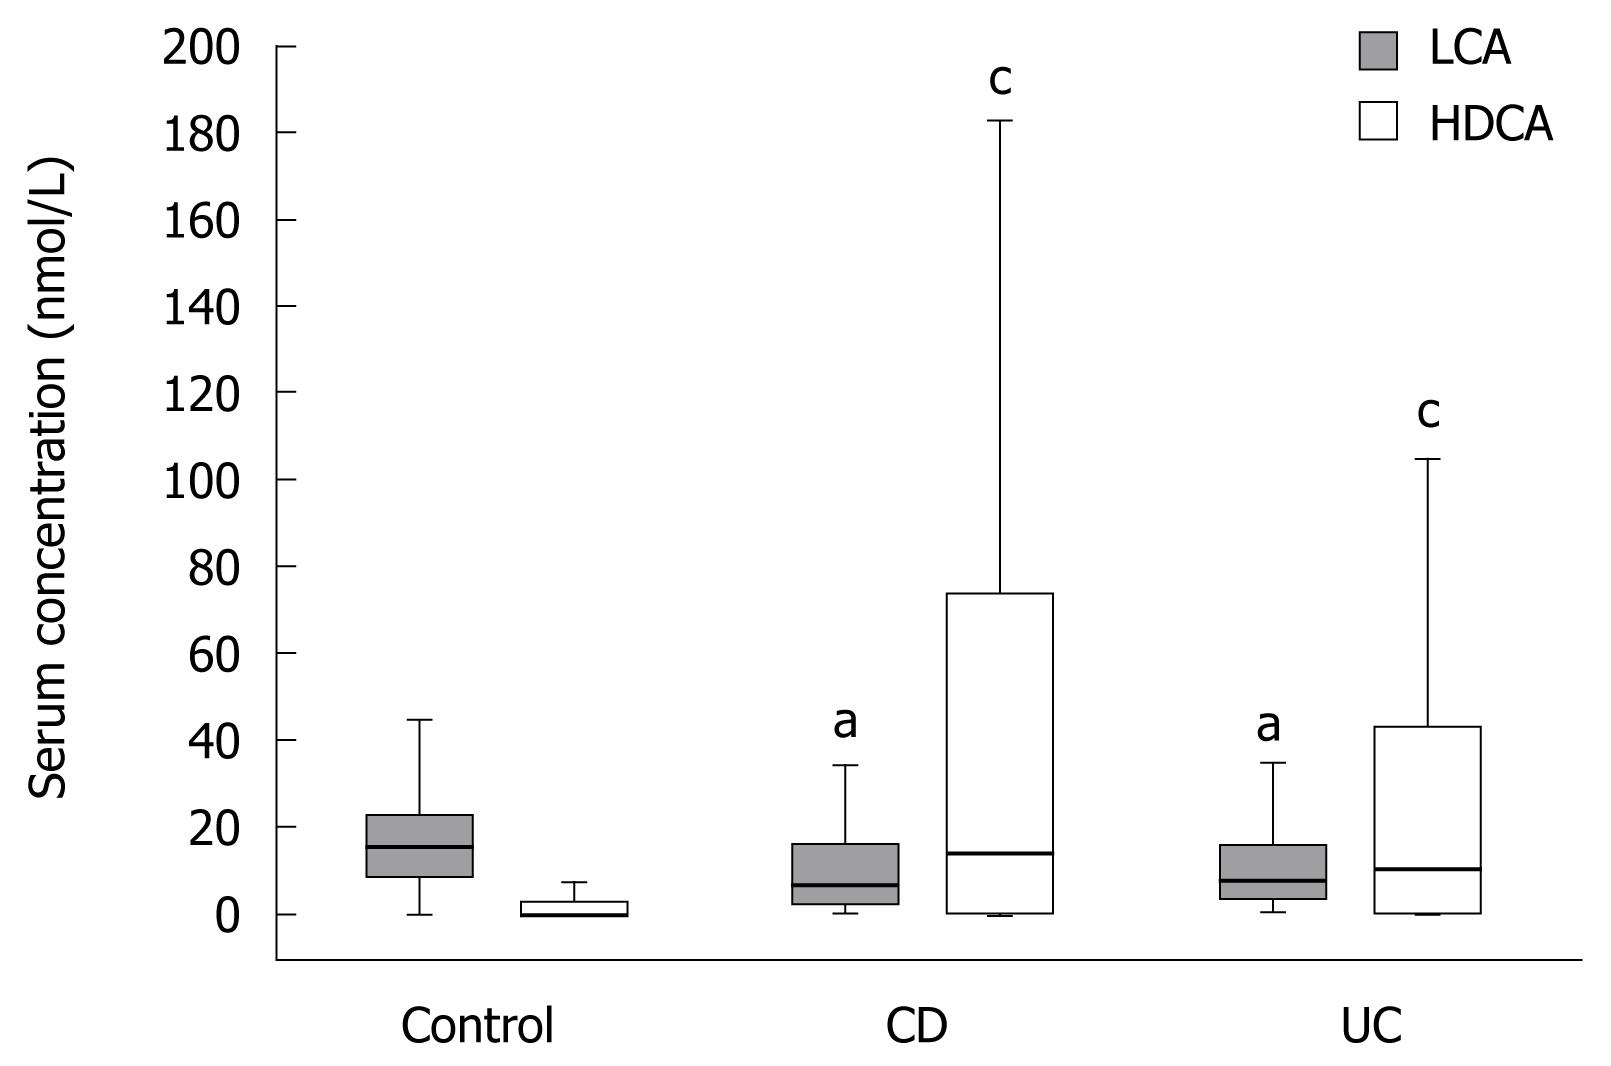
Figure 1 Decrease of serum LCA but increase of serum HDCA in CD and UC vs healthy control cohorts.
LCA and HDCA were analyzed using LC-ESI-MS/MS. Box plots represent interquartile ranges containing medians (boxes) and minimum/maximum bars. aP < 0.05 vs LCA in controls; cP < 0.05 vs HDCA in controls (Mann-Whitney U test).
- Citation: Gnewuch C, Liebisch G, Langmann T, Dieplinger B, Mueller T, Haltmayer M, Dieplinger H, Zahn A, Stremmel W, Rogler G, Schmitz G. Serum bile acid profiling reflects enterohepatic detoxification state and intestinal barrier function in inflammatory bowel disease. World J Gastroenterol 2009; 15(25): 3134-3141
- URL: https://www.wjgnet.com/1007-9327/full/v15/i25/3134.htm
- DOI: https://dx.doi.org/10.3748/wjg.15.3134


