Copyright
©2009 The WJG Press and Baishideng.
World J Gastroenterol. Jun 7, 2009; 15(21): 2657-2664
Published online Jun 7, 2009. doi: 10.3748/wjg.15.2657
Published online Jun 7, 2009. doi: 10.3748/wjg.15.2657
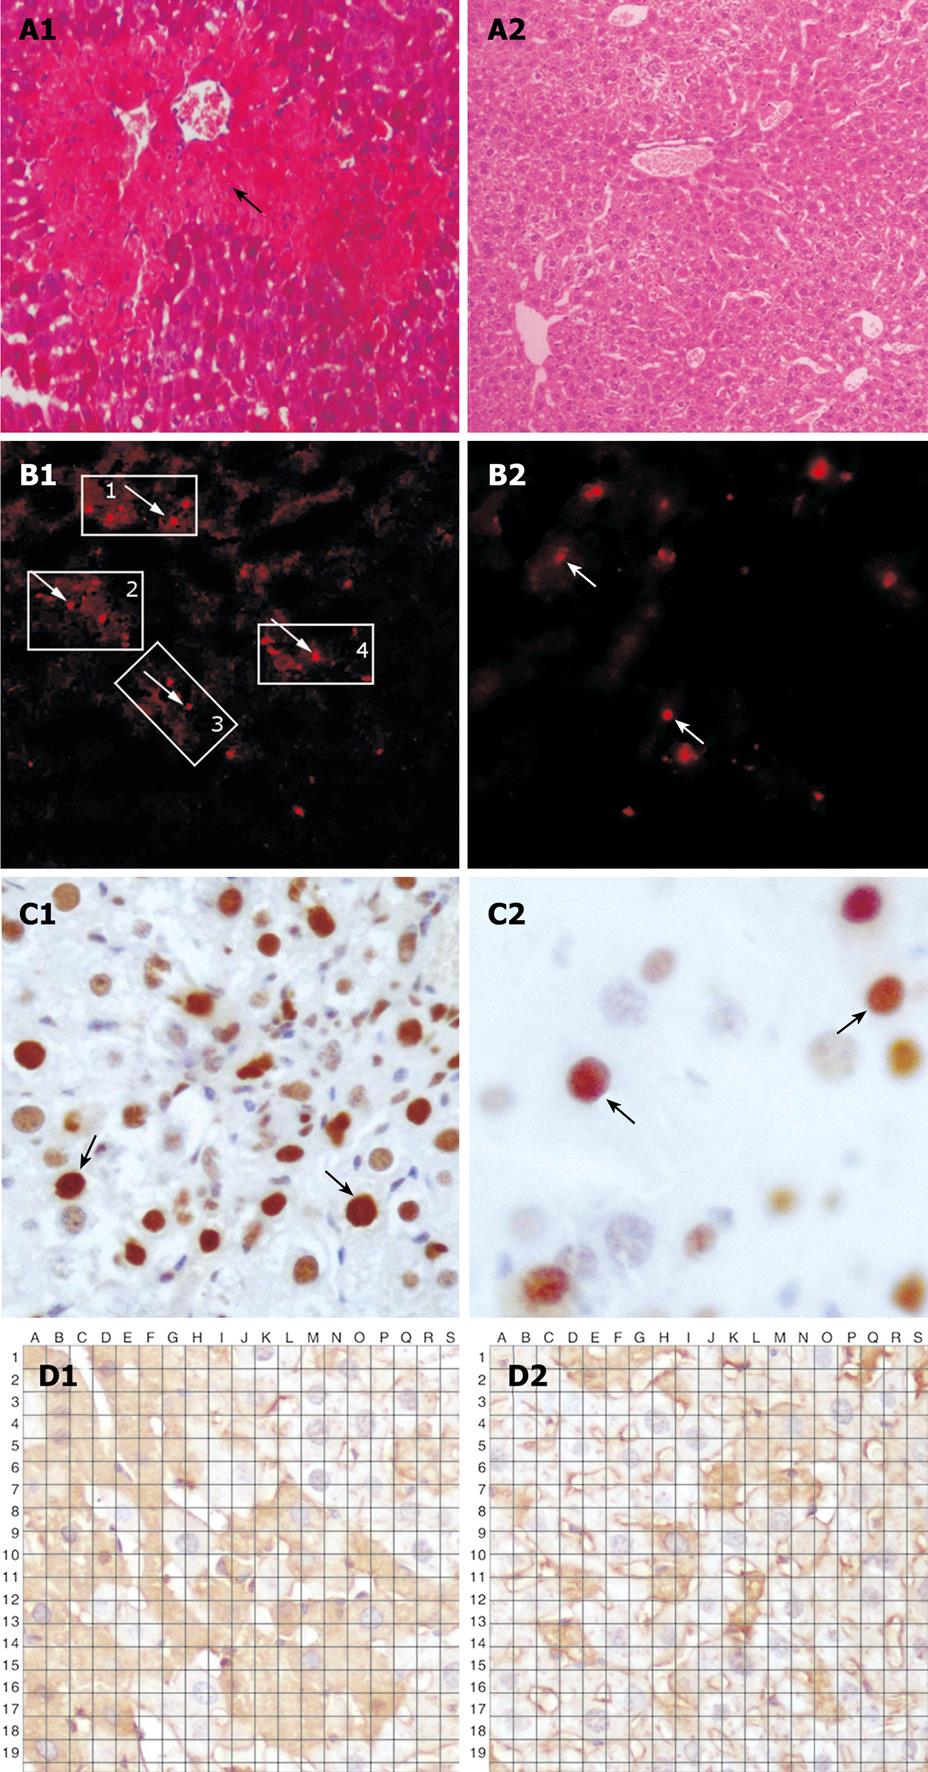
Figure 1 Histopathology of hepatic tissue from the two groups.
A: PKH26-labeled cells detected after establishment of acute liver failure animal model with extensive vacuolar degeneration and edema of hepatocytes in acute liver failure (A1) and normal liver tissue (A2); B: Sporadic PKH26-labeled bone marrow stem cells in experimental group (B1) and control group (B2); C: Expression of PCNA in sporadic PKH26-labeled bone marrow stem cells in experimental group (C1) and control group (C2); D: Expression of albumin and sporadic PKH26-labeled bone marrow stem cells in experimental group (D1) and control group (D2) ( × 200).
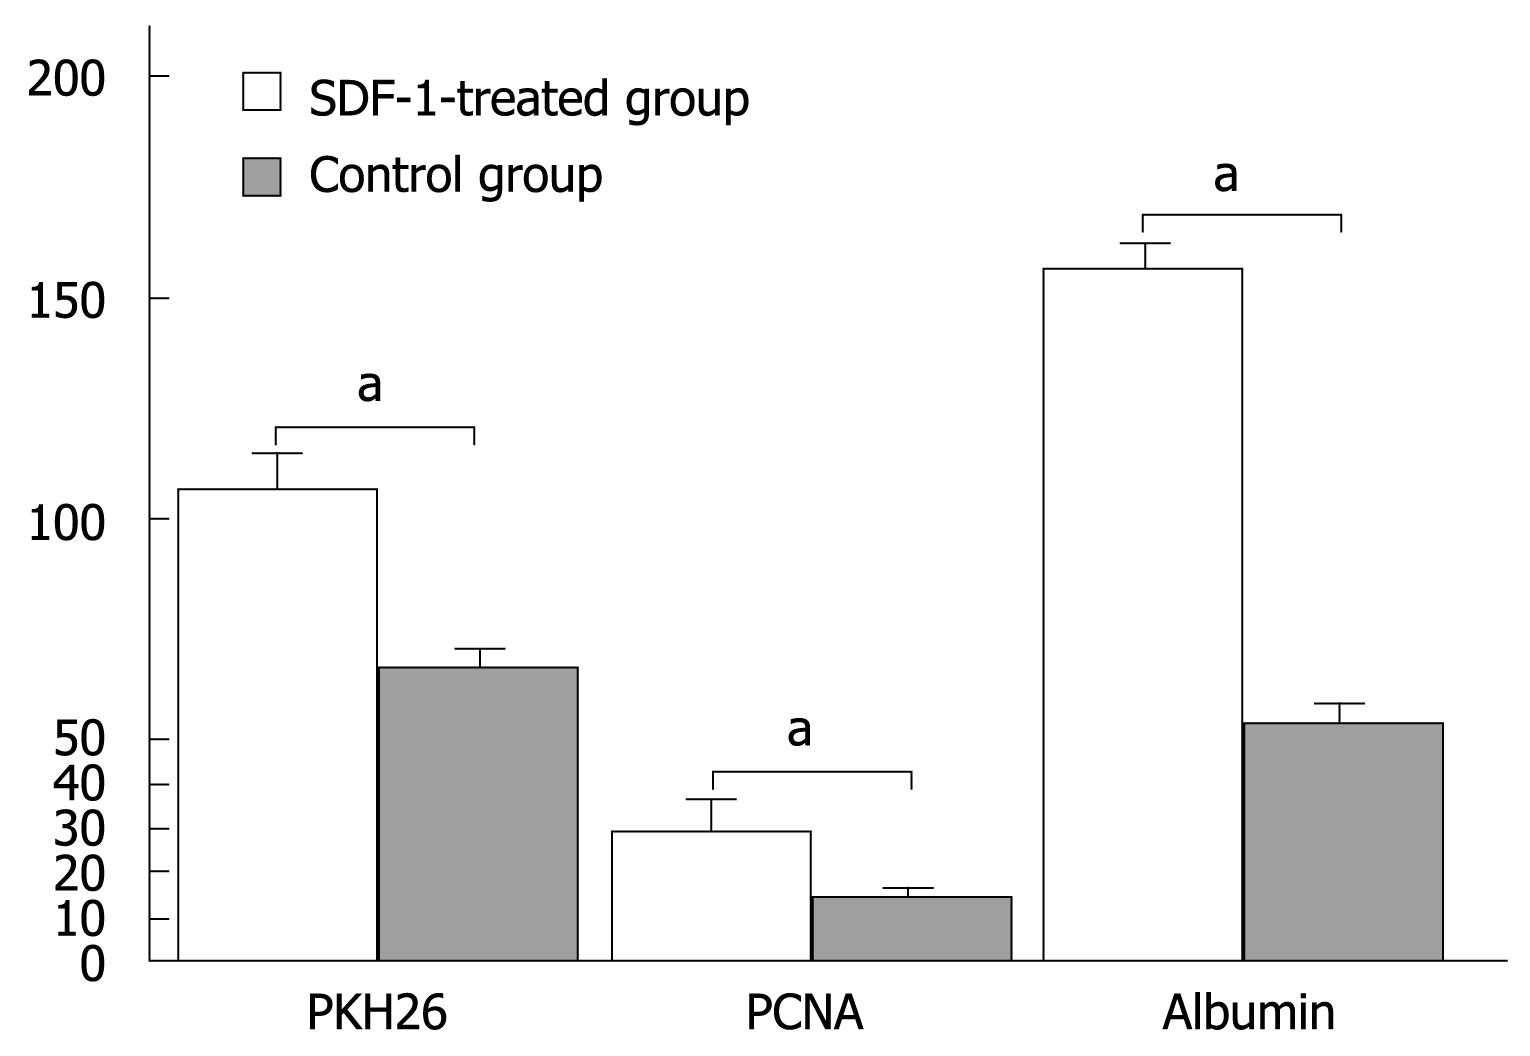
Figure 2 PKH26-labeled cells detected in experimental and control groups.
Data are expressed as mean ± SD. aP < 0.05 vs experimental group.
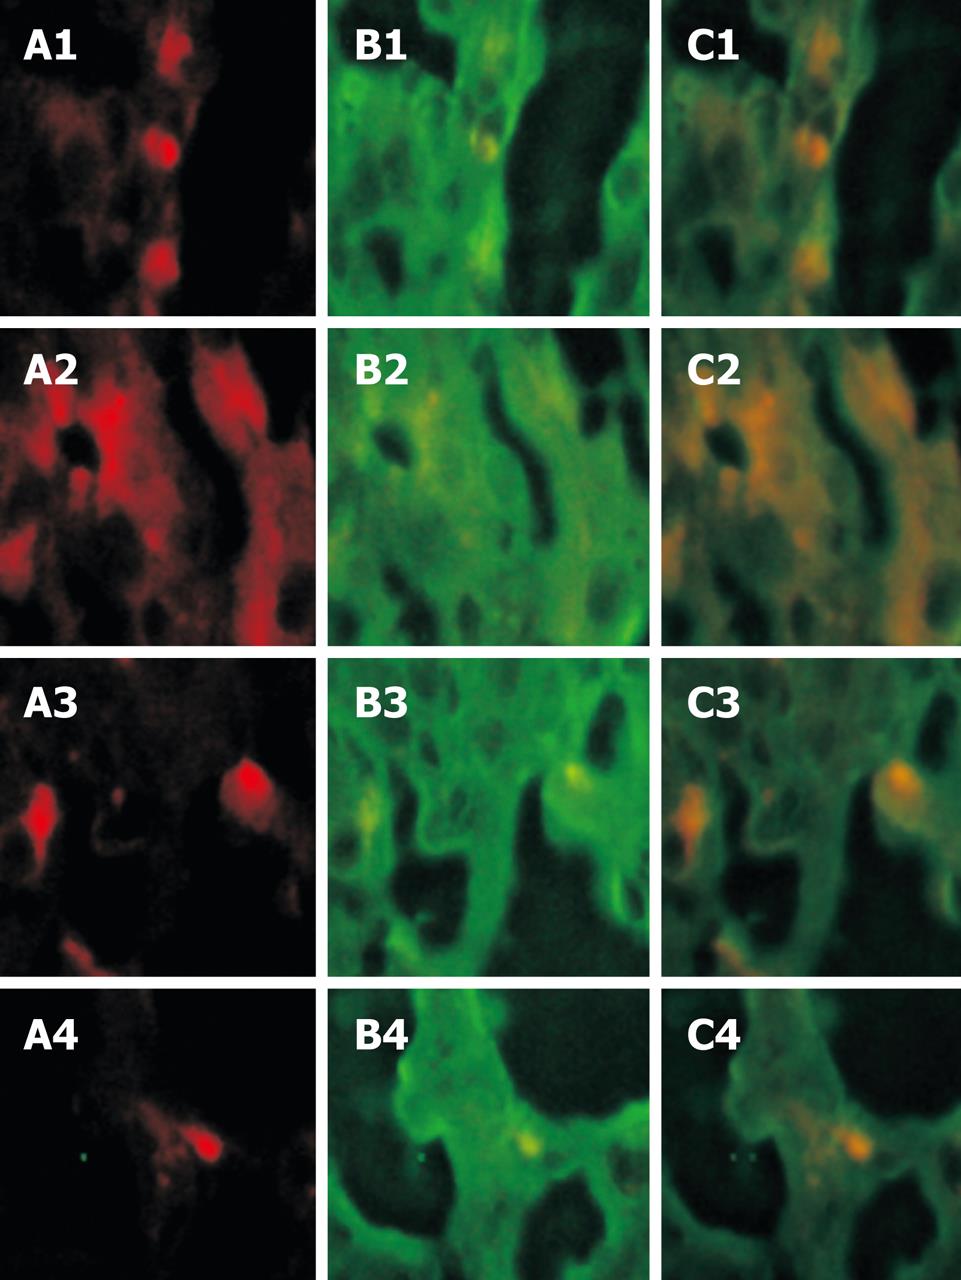
Figure 3 Confocal microscopy shows red fluorescence of cell location and green fluorescence of albumin.
The red fluorescence cells could be found in liver tissue of recipient mice, suggesting that PHK-26 positive cells can emerge out of the red fluorescence (A1-A4). The albumin expressed in hepatocytes showed green fluorescence (B1-B4). After the red and green fluorescence cells were located, yellow cells were found in a suitable location (C1-C4).
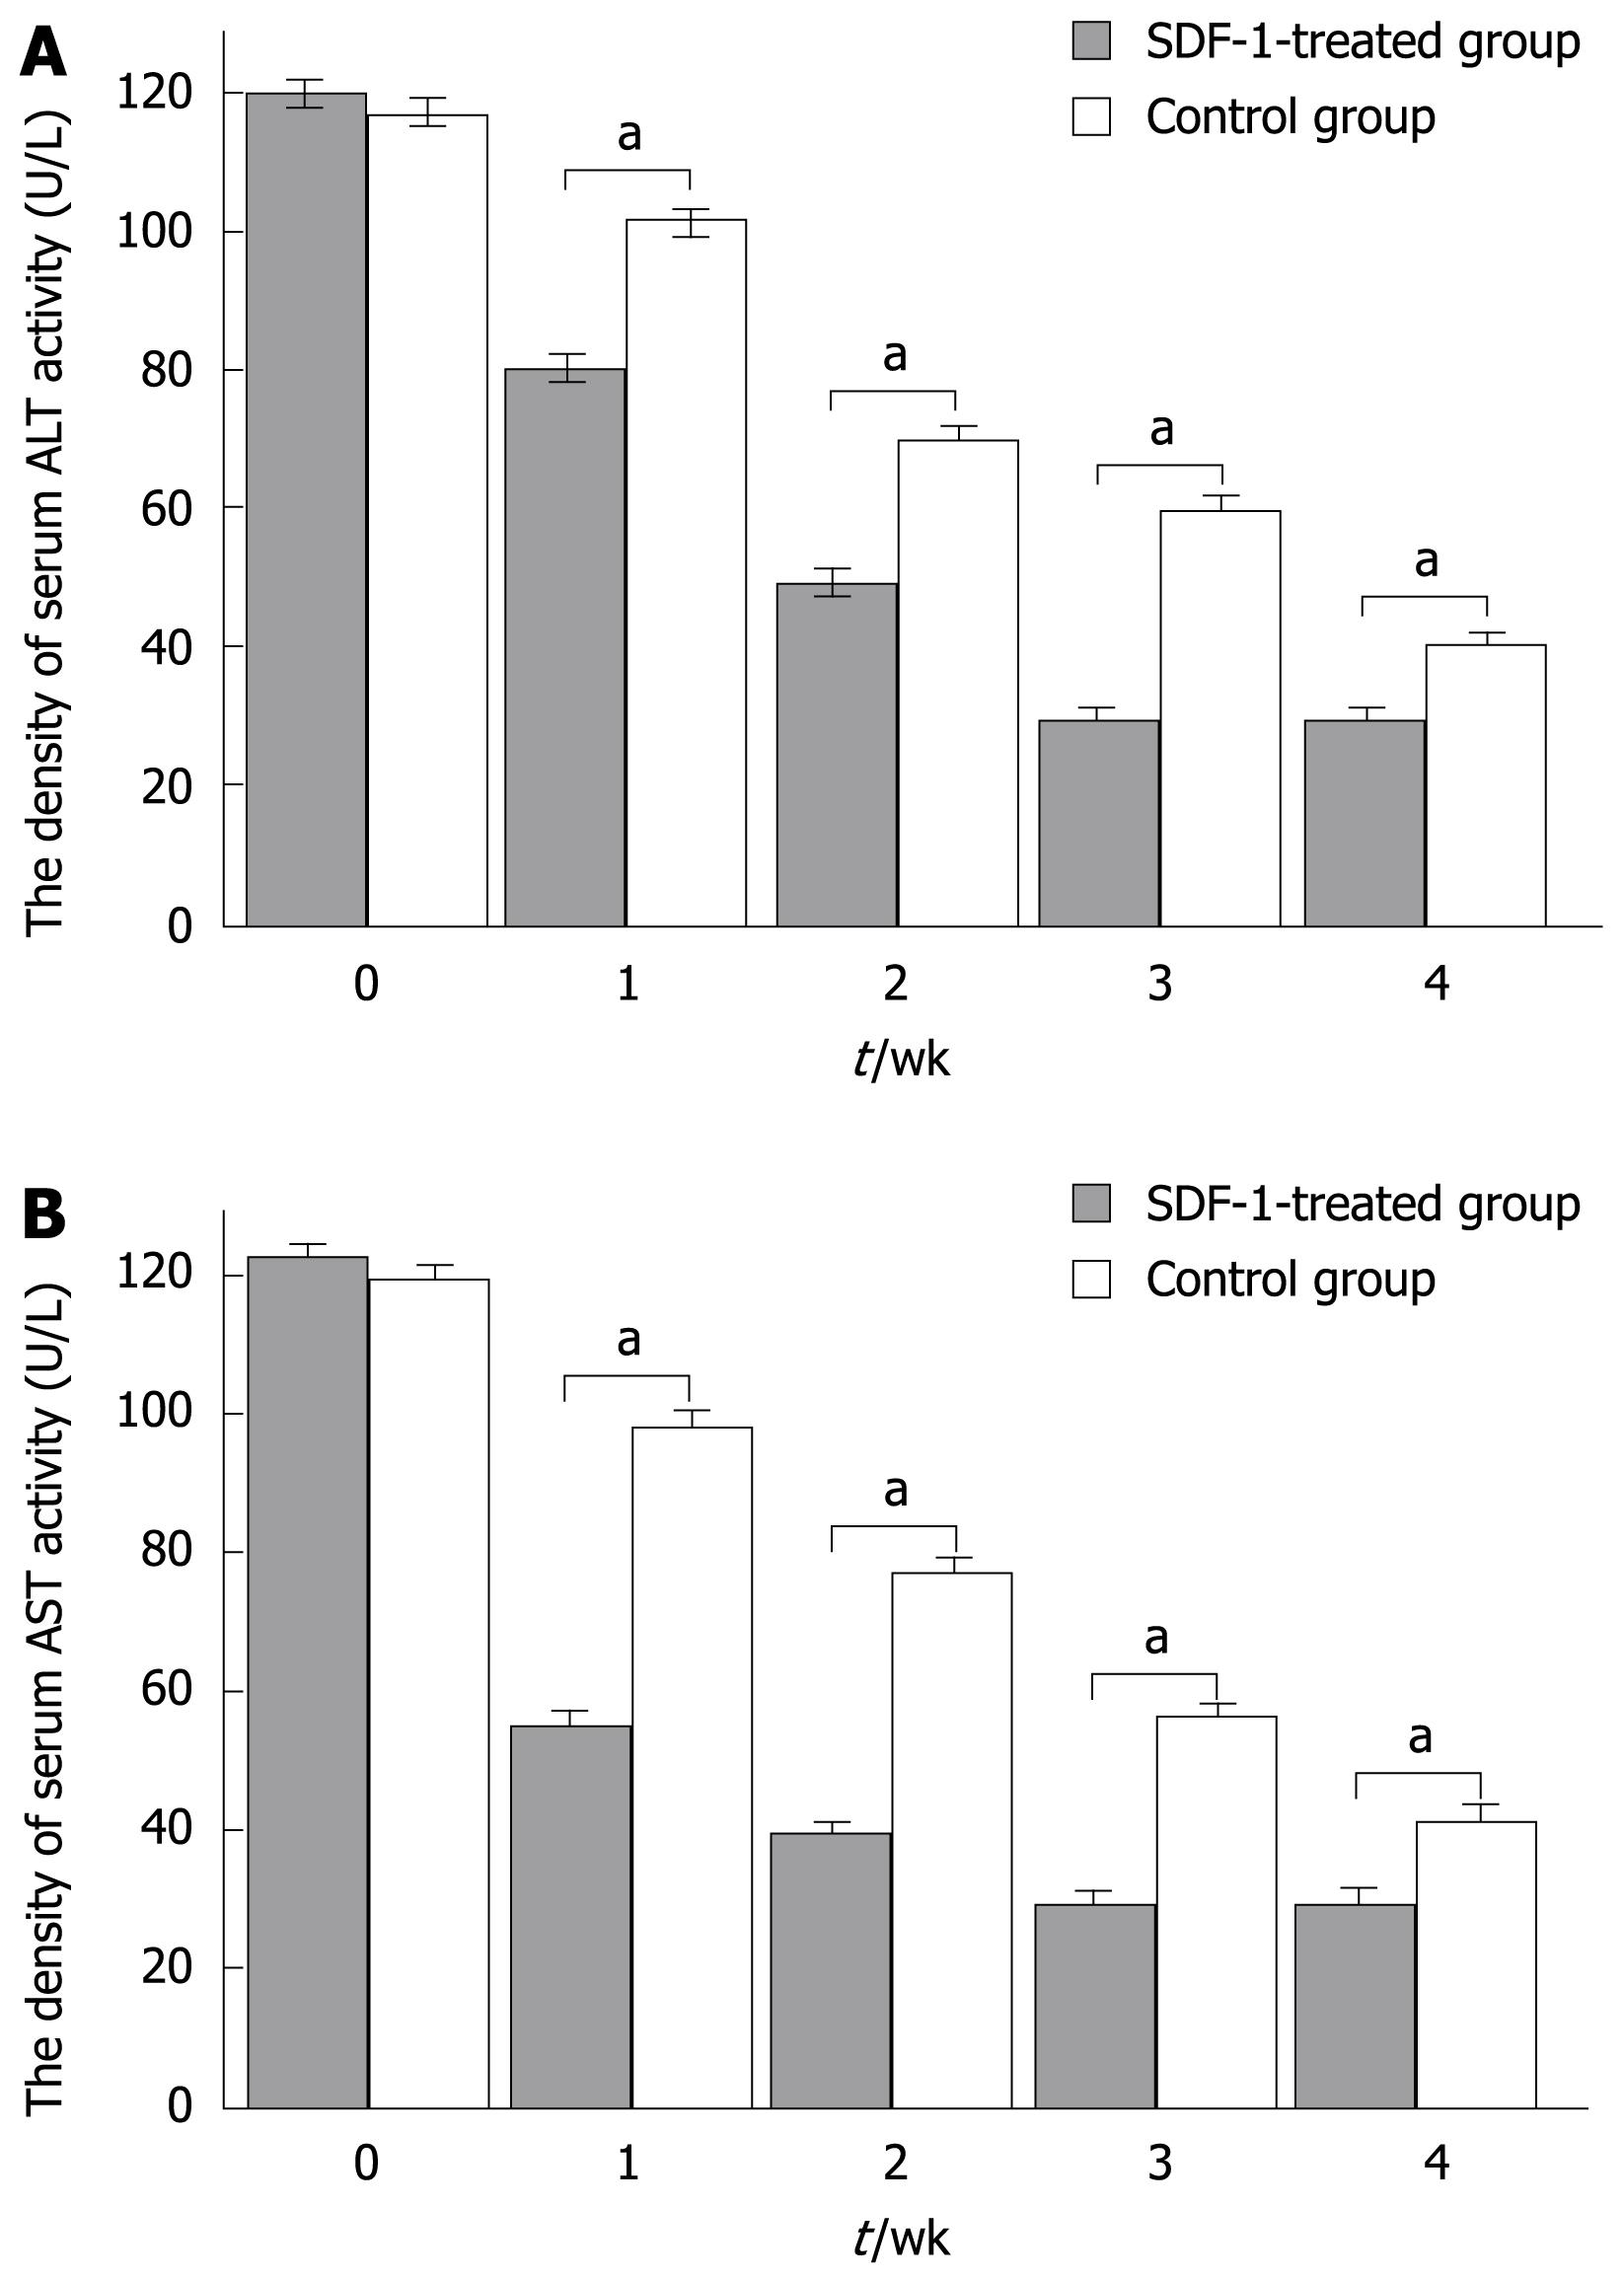
Figure 4 Detection of serum ALT (A) and AST (B) activity in the two groups.
The serum ALT and AST levels were measured with an automatic biochemistry analyzer in experimental and control groups. There was a significant difference between the two groups. At the same time, the serum AST level was measured. aP < 0.05 vs experimental group.
- Citation: Jin SZ, Meng XW, Han MZ, Sun X, Sun LY, Liu BR. Stromal cell derived factor-1 enhances bone marrow mononuclear cell migration in mice with acute liver failure. World J Gastroenterol 2009; 15(21): 2657-2664
- URL: https://www.wjgnet.com/1007-9327/full/v15/i21/2657.htm
- DOI: https://dx.doi.org/10.3748/wjg.15.2657


