Copyright
©2009 The WJG Press and Baishideng.
World J Gastroenterol. Jan 14, 2009; 15(2): 169-176
Published online Jan 14, 2009. doi: 10.3748/wjg.15.169
Published online Jan 14, 2009. doi: 10.3748/wjg.15.169
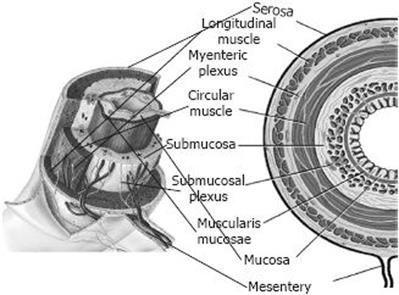
Figure 1 Schematic diagram of the GI tract.
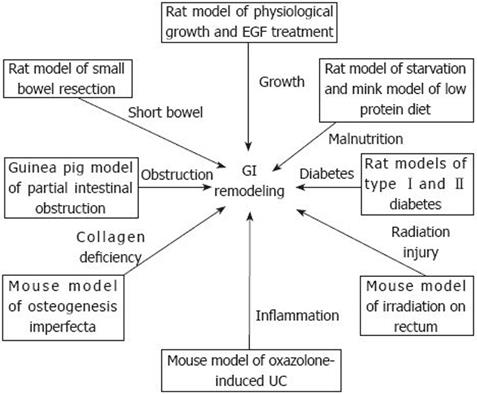
Figure 2 Disease-induced GI remodeling in animal models.
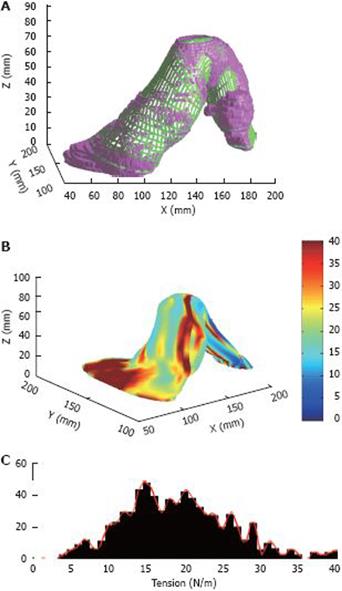
Figure 3 A reconstructed sigmoid-colon model and the corresponding tension distribution.
A: A representative sigmoid colon model with the distension volume of 200 mL. The model with purple colour is the solid model generated directly from the MR images, and the green mesh is the smoothened surface, the comparison between the solid model and smoothened surface indicates that the smoothened model fits well with the original solid model; B: The circumferential curvature distribution on the surface models; C: Tension distribution of the sigmoid colon surface model.
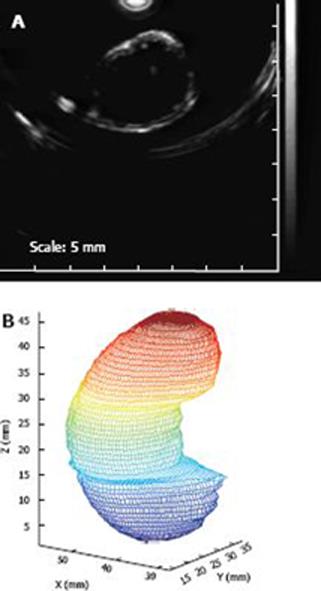
Figure 4 An example of the anatomically based in vitro rat stomach model generated from ultrasonic scanning.
A: A representative CT scanning of a cross sectional slice of an in vitro rat stomach; B: The reconstructed gastric model on the basis of the CT scanning on the in vitro rat stomach. The distance between cross sectional slices was 1 mm, the colour change from blue to red means the increase of the stomach length in z direction.
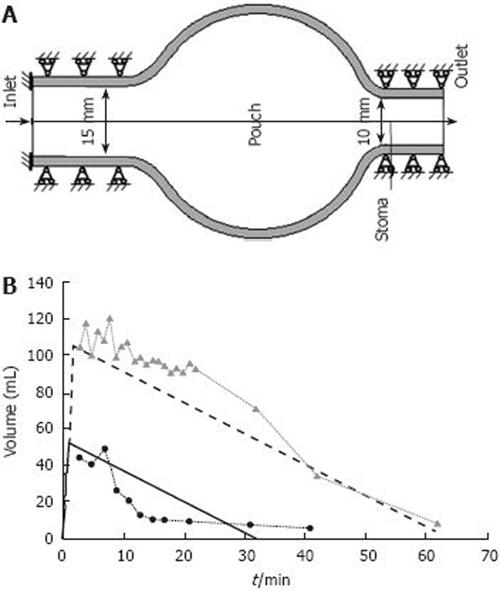
Figure 5 A simplified pouch model for describing the gastric emptying of a patient treated for obesity.
A: A representative pouch model of midsized pouch with stoma diameter of 10 mm, B: Volume history in the filling and emptying phases in the mid-sized and large pouch models with stoma diameter of 10 mm. The solid line represents the mid-sized pouch, and the dotted line the large pouch. Circles and triangles represent volume data of the recorded clinical emptying curve for the mid-sized and large pouch. Pouch and stoma are a small fundic cavity and a corresponding narrow outlet between pouch and the rest of the stomach in gastroplasty and gastric bypass procedures for obesity.
- Citation: Liao DH, Zhao JB, Gregersen H. Gastrointestinal tract modelling in health and disease. World J Gastroenterol 2009; 15(2): 169-176
- URL: https://www.wjgnet.com/1007-9327/full/v15/i2/169.htm
- DOI: https://dx.doi.org/10.3748/wjg.15.169


