Copyright
©2009 The WJG Press and Baishideng.
World J Gastroenterol. Jan 14, 2009; 15(2): 169-176
Published online Jan 14, 2009. doi: 10.3748/wjg.15.169
Published online Jan 14, 2009. doi: 10.3748/wjg.15.169
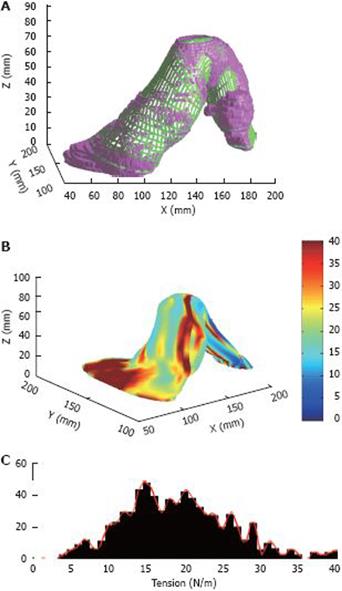
Figure 3 A reconstructed sigmoid-colon model and the corresponding tension distribution.
A: A representative sigmoid colon model with the distension volume of 200 mL. The model with purple colour is the solid model generated directly from the MR images, and the green mesh is the smoothened surface, the comparison between the solid model and smoothened surface indicates that the smoothened model fits well with the original solid model; B: The circumferential curvature distribution on the surface models; C: Tension distribution of the sigmoid colon surface model.
- Citation: Liao DH, Zhao JB, Gregersen H. Gastrointestinal tract modelling in health and disease. World J Gastroenterol 2009; 15(2): 169-176
- URL: https://www.wjgnet.com/1007-9327/full/v15/i2/169.htm
- DOI: https://dx.doi.org/10.3748/wjg.15.169


