Copyright
©2009 The WJG Press and Baishideng.
World J Gastroenterol. May 14, 2009; 15(18): 2220-2227
Published online May 14, 2009. doi: 10.3748/wjg.15.2220
Published online May 14, 2009. doi: 10.3748/wjg.15.2220
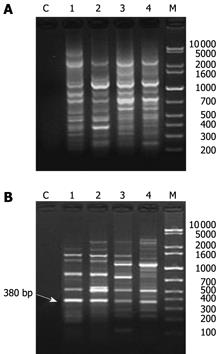
Figure 1 ERIC-PCR fingerprinting of intestinal microflora from feces of 8 out of 128 rats before (A) and after (B) Pi-deficiency induced by Radix and Rhizoma Rhei.
C: Water administration; M: Ladder; lanes 1-8: rats. Rat No. 3 died of trauma after uptake of Radix and Rhizoma Rhei.
Figure 2 ERIC-PCR fingerprinting of intestinal microflora from feces of 4 out of 128 rats before (A) and after (B) Pi-deficiency induced by Folium Sennae.
C: Water administration; M: Ladder; lanes 1-4: rats.
Figure 3 Shannon’s index of ERIC-PCR fingerprintings of Pi-deficient rats before and after TCM treatment.
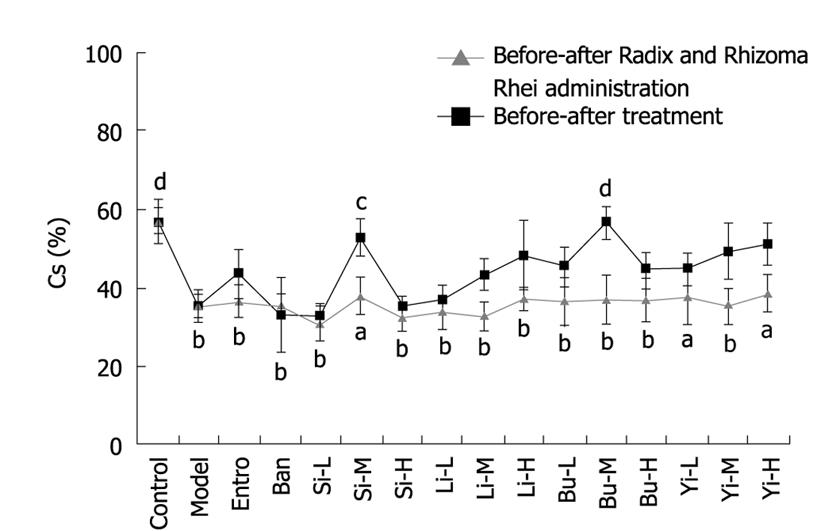
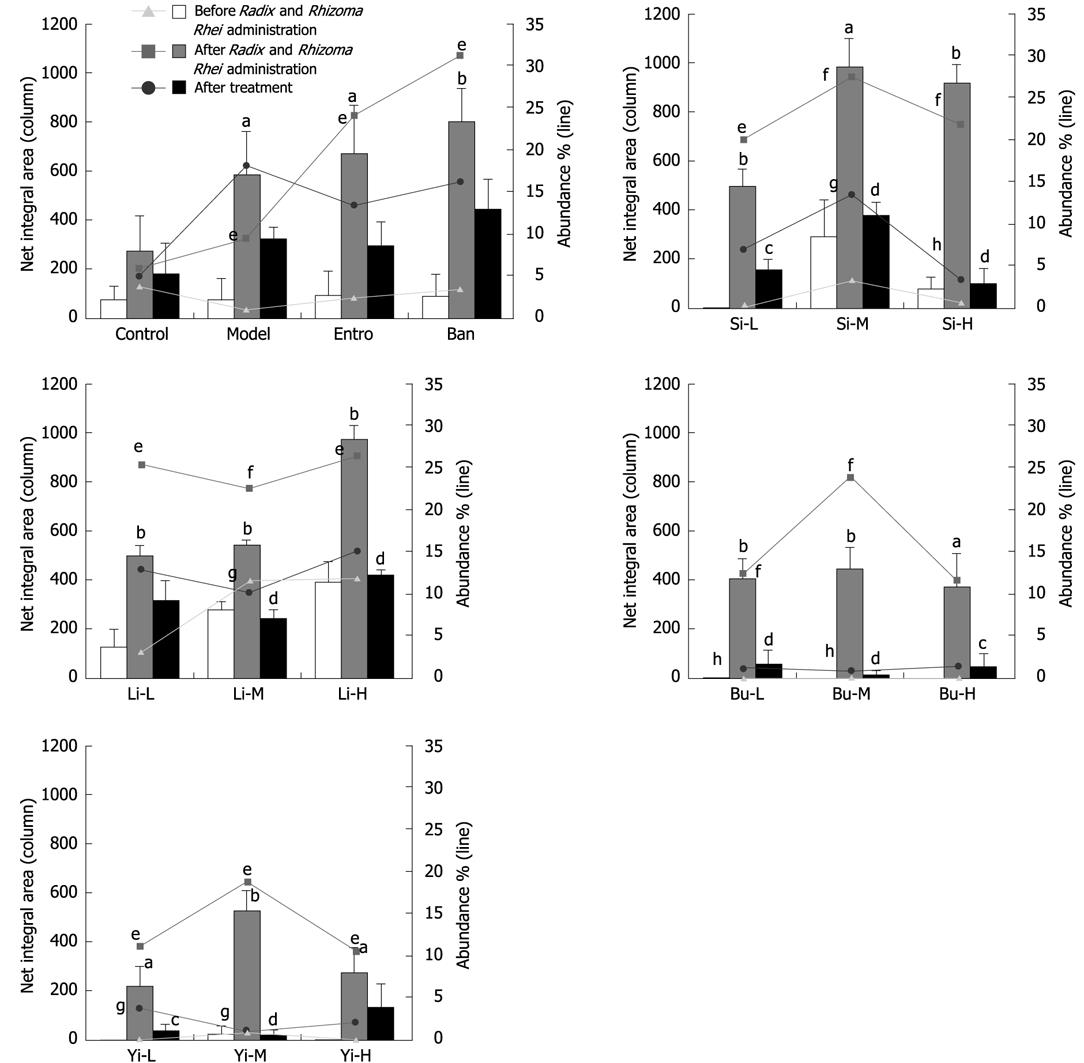
Pi-deficiency was induced by Radix and Rhizoma Rhei first in all groups except for the control group (Group 1) that received distilled water. Control: Group 1 received distilled water in both inducement and treatment phases. Model: Group 2 received Radix et Rhizoma Rhei but distilled water during treatment; Entro: Group 3 received Entrocoordinatibiogen during treatment; Ban: Group 4 received decoction of Ban-xia-hou-pu-tang during treatment; Si-L, Si-M, Si-H: Groups 5-7 received low, middle and high doses of Si-jun-zi-tang, respectively; Li-L, Li-M, Li-H: Groups 8-10 received low, middle and high doses of Li-zhong-tang, respectively; Bu-L, Bu-M, Bu-H: Group 11-13 received low, middle and high doses of Buzhong Yiqi Tang, respectively; Yi-L, Yi-M, Yi-H: Groups 14-16, received low, middle and high doses of Yi-wei-tang, respectively.
Figure 4 Similarity coefficient (Cs) for ERIC-PCR fingerprintings of Pi-deficient rats before and after treatment.
Samples were the same as in Figure 3. Gray: Cs before and after Radix and Rhizoma Rhei uptake; Black: Cs before and after treatment. Statistical significance of differences was calculated by One-Way ANOVA. aP < 0.05, bP < 0.01 vs control group; cP < 0.05, dP < 0.01 vs model group.
Figure 5 Net integral area and abundance of the 380 bp fragment in rats with Pi-deficiency induced by Radix and Rhizoma Rhei and after treatment.
Columns: Net integral area of the 380 bp fragment; Lines: Abundance of 380 bp fragment. aP < 0.05, bP < 0.01 vs healthy condition; cP < 0.05, dP < 0.01 vs Pi-deficiency status; eP < 0.05, fP < 0.01 vs healthy condition; gP < 0.05, hP < 0.01 vs Pi-deficiency status. Samples were the same as in Figure 3.
- Citation: Peng Y, Wang Z, Lu Y, Wu CF, Yang JY, Li XB. Intestinal microflora molecular markers of spleen-deficient rats and evaluation of traditional Chinese drugs. World J Gastroenterol 2009; 15(18): 2220-2227
- URL: https://www.wjgnet.com/1007-9327/full/v15/i18/2220.htm
- DOI: https://dx.doi.org/10.3748/wjg.15.2220


