Copyright
©2009 The WJG Press and Baishideng.
World J Gastroenterol. Apr 14, 2009; 15(14): 1744-1750
Published online Apr 14, 2009. doi: 10.3748/wjg.15.1744
Published online Apr 14, 2009. doi: 10.3748/wjg.15.1744
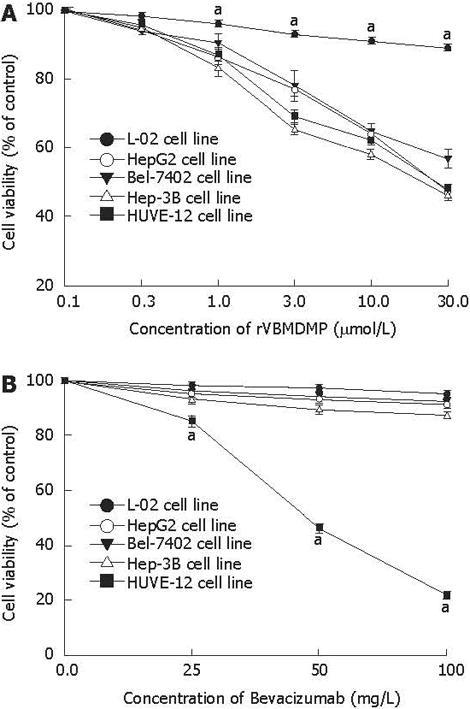
Figure 1 Proliferation of HCC (A) and ECs (B) selectively inhibited by rVBMDMP (mean ± SD, n = 9).
aP < 0.05 vs other cells.
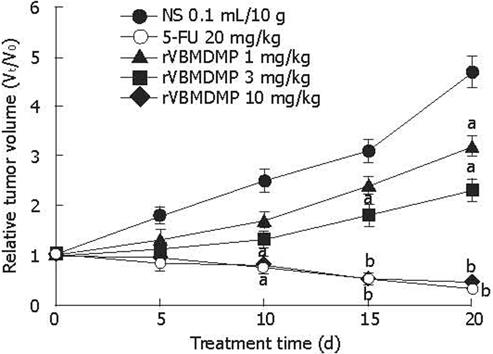
Figure 2 Robust efficacy of rVBMDMP against HepG2 xenografts in nude mice (mean ± SD, n = 6).
aP < 0.05, bP < 0.01 vs NS.
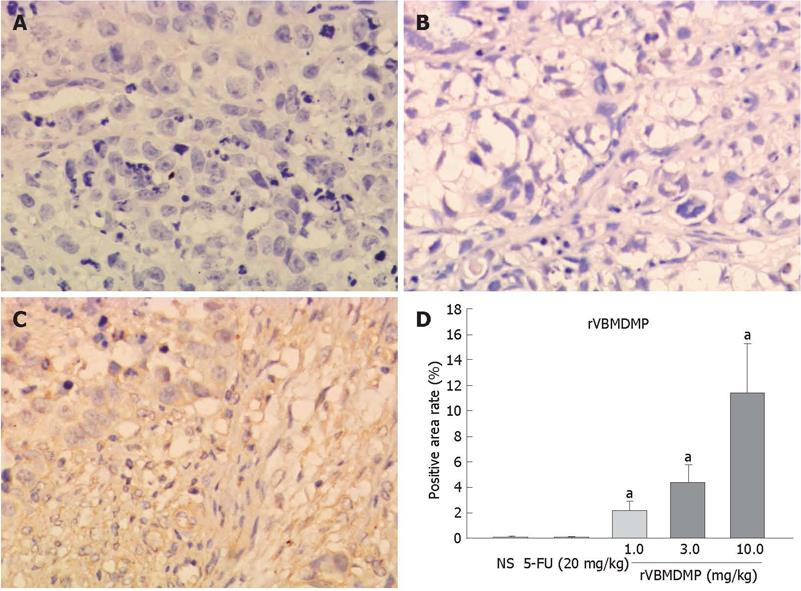
Figure 3 Accumulation of rVBMDMP in HepG2 xenografts in nude mice after treatment.
A: NS; B: 20 mg/kg of 5-FU; C: 10 mg/kg of rVBMDMP; D: Quantification of rVBMDMP-positive areas in HepG2 xenografts. The data are expressed as mean ± SD (n = 6). aP < 0.05 vs NS.
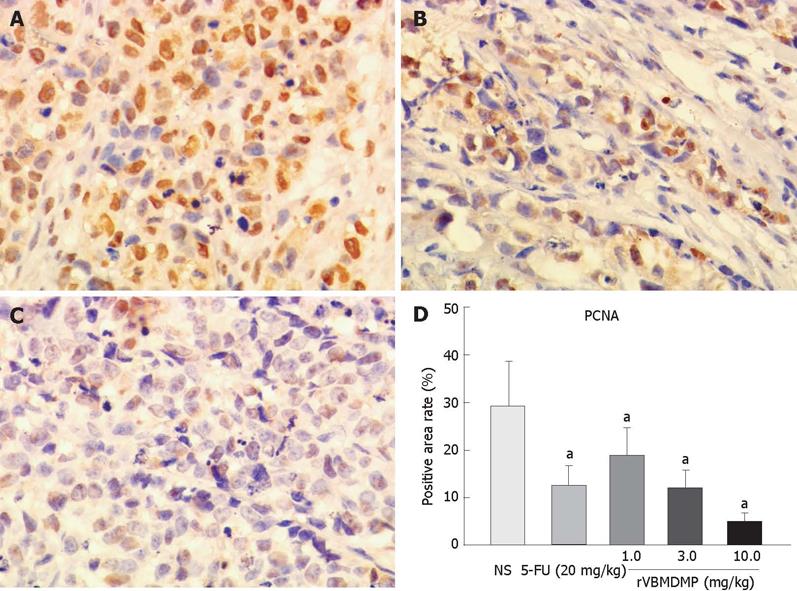
Figure 4 Expression of PCNA in HepG2 xenografts in nude mice after treatment.
A: NS; B: 20 mg/kg of 5-FU; C: 10 mg/kg of rVBMDMP; D: Quantification of PCNA-positive areas in HepG2 tumors. The data are expressed as mean ± SD (n = 6). aP < 0.05 vs NS.
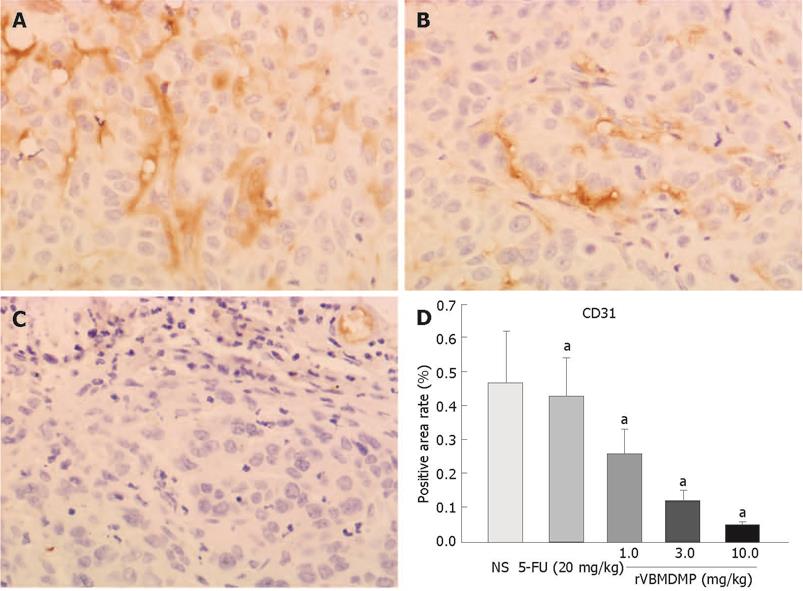
Figure 5 Microvessel density of HepG2 xenografts in nude mice after treatment.
A: NS; B: 20 mg/kg of 5-FU; C: 10 mg/kg of rVBMDMP; D: Quantification of microvessel density (CD31 staining) positive areas in HepG2 xenografts in nude mice. The data are expressed as mean ± SD (n = 6). aP < 0.05 vs NS.
- Citation: Wu YH, Cao JG, Xiang HL, Xia H, Qin Y, Huang AJ, Xiao D, Xu F. Recombinant vascular basement-membrane-derived multifunctional peptide inhibits angiogenesis and growth of hepatocellular carcinoma. World J Gastroenterol 2009; 15(14): 1744-1750
- URL: https://www.wjgnet.com/1007-9327/full/v15/i14/1744.htm
- DOI: https://dx.doi.org/10.3748/wjg.15.1744


