Copyright
©2009 The WJG Press and Baishideng.
World J Gastroenterol. Apr 7, 2009; 15(13): 1656-1659
Published online Apr 7, 2009. doi: 10.3748/wjg.15.1656
Published online Apr 7, 2009. doi: 10.3748/wjg.15.1656
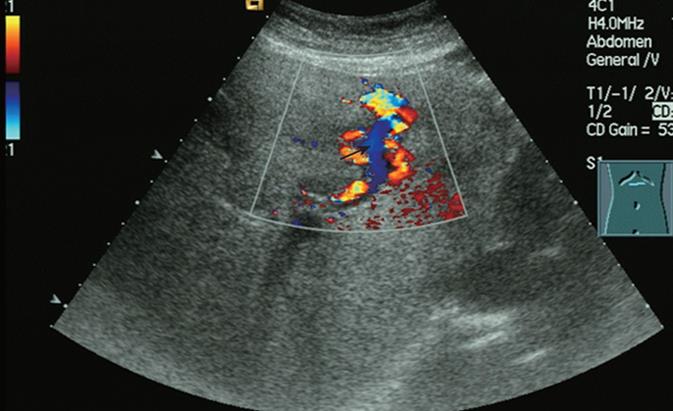
Figure 1 Color Doppler sonography of the portal vein aneurysm showing increased blood flow in the LPV and turbulence (arrow) at the distal portion of the aneurysmal sac.
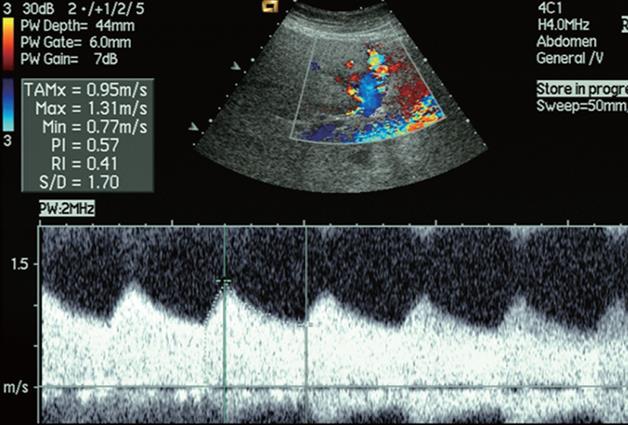
Figure 2 PW Doppler sonography of the portal vein aneurysm showing a high speed blood flow at 1.
31 m/s in the aneurysm.
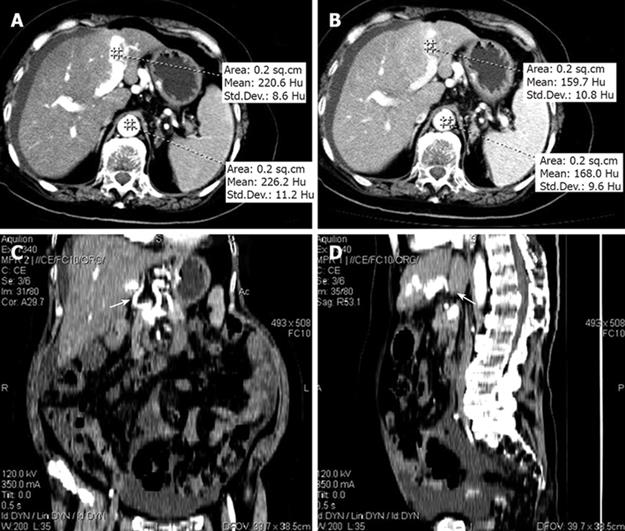
Figure 3 Contrast-enhanced CT showing a LPV density of 220.
6 Hu and an abdominal aorta density of 226.2 Hu at artery phase (A), a LPV density of 159.7 Hu and an abdominal aorta density of 168.0 Hu at portal venous phase (B), and CT of coronal section (C) and sagittal section (D) showing the direct shunt of APF.
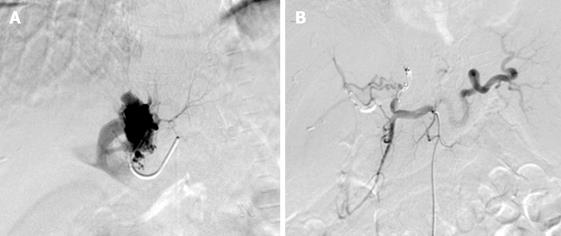
Figure 4 Selective digital subtraction angiography of the hepatic artery.
A: A large left hepatic artery-left portal vein fistula; B: No more shunt after embolism.
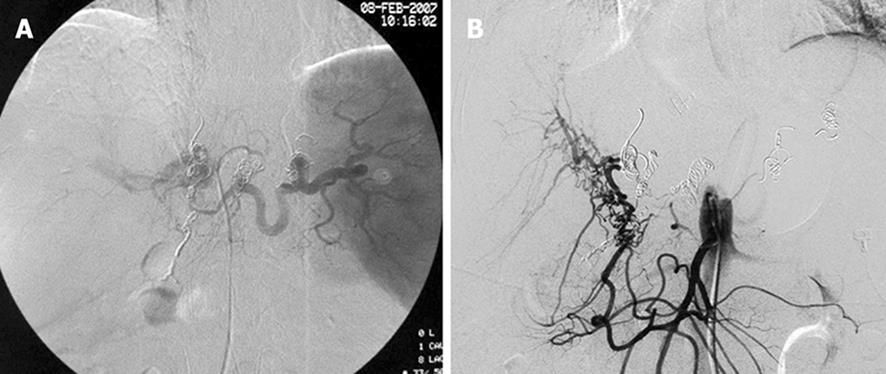
Figure 5 Angiography showing collateral circulation in fistula after embolism (A) and no more shunt after embolism (B).
- Citation: Lu ZY, Ao JY, Jiang TA, Peng ZY, Wang ZK. A large congenital and solitary intrahepatic arterioportal fistula in an old woman. World J Gastroenterol 2009; 15(13): 1656-1659
- URL: https://www.wjgnet.com/1007-9327/full/v15/i13/1656.htm
- DOI: https://dx.doi.org/10.3748/wjg.15.1656


