Copyright
©2009 The WJG Press and Baishideng.
World J Gastroenterol. Mar 21, 2009; 15(11): 1339-1345
Published online Mar 21, 2009. doi: 10.3748/wjg.15.1339
Published online Mar 21, 2009. doi: 10.3748/wjg.15.1339
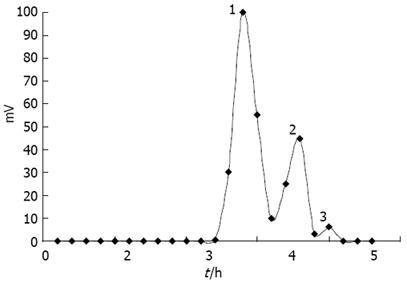
Figure 1 Chromatogram of COSs on Sephadex G-25 column.
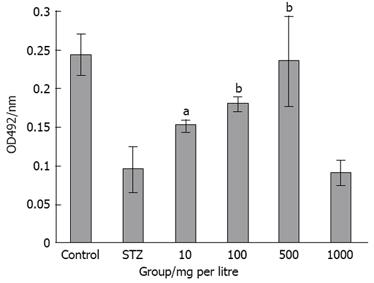
Figure 2 Protective effect of COS on the damage of NIT-1 cells induced by STZ.
aP < 0.05, bP < 0.01 vs STZ group.
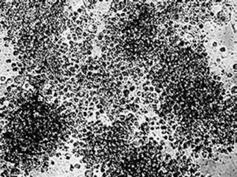
Figure 3 Morphological photograph of the positive control group (× 100).
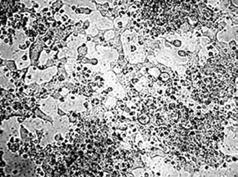
Figure 4 Morphological photograph of 500 mg/L COS protective group (× 100).
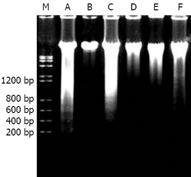
Figure 5 COS protective effect on NIT-1 cell genomic DNA presented by DNA Ladder method.
M: 200 bp Marker; A: Positive control group; B: Normal control group; C: 1000 mg/L COS treatment group; D: 500 mg/L COS treatment group; E: 100 mg/L COS treatment group; F: 10 mg/L COS treatment group.
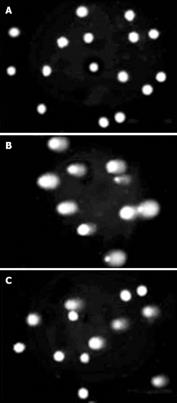
Figure 6 Photomicrograph of NIT-1 cells DNA migration in different experimental groups (× 200).
A: Normal control group; B: Positive control group; C: COS treatment group.
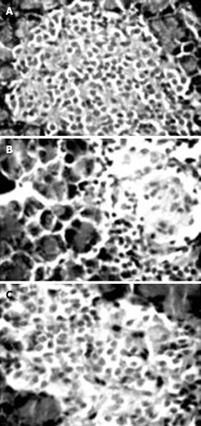
Figure 7 Photomicrograph of pancreas tissue slice in different experimental groups (HE × 400).
A: Normal control group; B: Positive control group; C: COS treatment group.
- Citation: Yuan WP, Liu B, Liu CH, Wang XJ, Zhang MS, Meng XM, Xia XK. Antioxidant activity of chito-oligosaccharides on pancreatic islet cells in streptozotocin-induced diabetes in rats. World J Gastroenterol 2009; 15(11): 1339-1345
- URL: https://www.wjgnet.com/1007-9327/full/v15/i11/1339.htm
- DOI: https://dx.doi.org/10.3748/wjg.15.1339


