Copyright
©2009 The WJG Press and Baishideng.
World J Gastroenterol. Mar 14, 2009; 15(10): 1242-1245
Published online Mar 14, 2009. doi: 10.3748/wjg.15.1242
Published online Mar 14, 2009. doi: 10.3748/wjg.15.1242
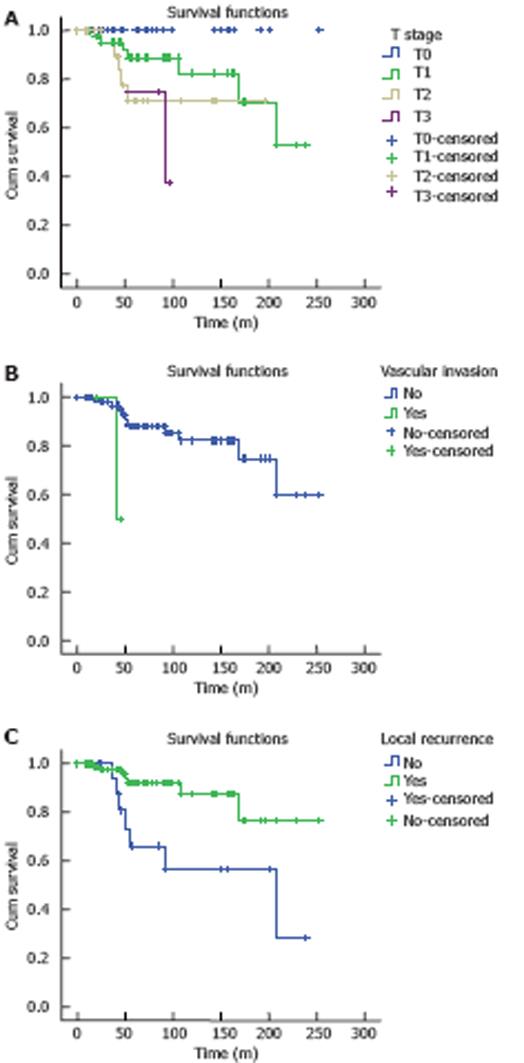
Figure 1 Survival curves for patients with different tumor T stages (A), different vascular invasions (B), and different local recurrence rates (C).
The survival rate for the patients with T0 (n = 28), T1 (n = 48), T2 (n = 26), T3 (n = 4) varied significantly (P = 0.022). Patients without vascular invasion (n = 103) had a higher survival rate than those with vascular invasion. (n = 3) (P = 0.01). Patients without local recurrence (n = 88) had a higher survival rate than those with local recurrence (n = 18) (P = 0.005).
- Citation: Zhao DB, Wu YK, Shao YF, Wang CF, Cai JQ. Prognostic factors for 5-year survival after local excision of rectal cancer. World J Gastroenterol 2009; 15(10): 1242-1245
- URL: https://www.wjgnet.com/1007-9327/full/v15/i10/1242.htm
- DOI: https://dx.doi.org/10.3748/wjg.15.1242


