Copyright
©2009 The WJG Press and Baishideng.
World J Gastroenterol. Mar 14, 2009; 15(10): 1231-1236
Published online Mar 14, 2009. doi: 10.3748/wjg.15.1231
Published online Mar 14, 2009. doi: 10.3748/wjg.15.1231
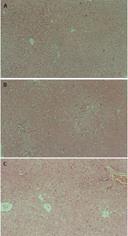
Figure 1 Histopathology of liver tissue at 6 h (HE, × 10).
A: Normal group; B: Model group; C: Protected group.
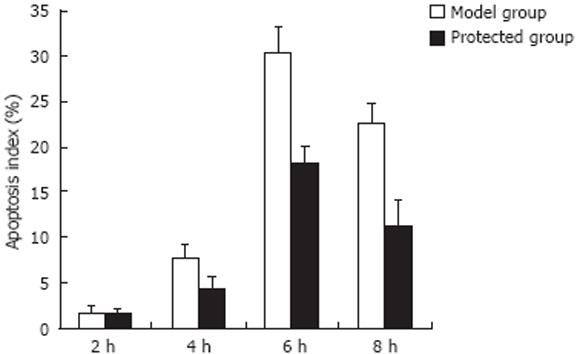
Figure 2 Apoptosis in the model group and protected group measured by TUNEL assay.
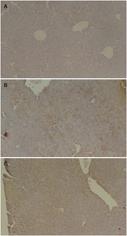
Figure 3 Immunohistochemical analysis of cathepsin B at 8 h (HE, × 10).
A: Normal group; B: Model group; C: Protected group.
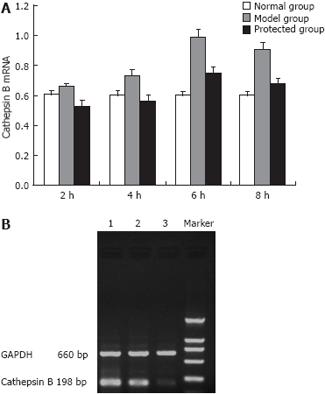
Figure 4 RT-PCR analysis of expression of cathepsin B mRNA in the normal, model and protected groups.
A: Expression of cathepsin B mRNA in different groups; B: Images of agarose gel electrophoresis at 6 h; 1: Model group; 2: Protected group; 3: Normal group.
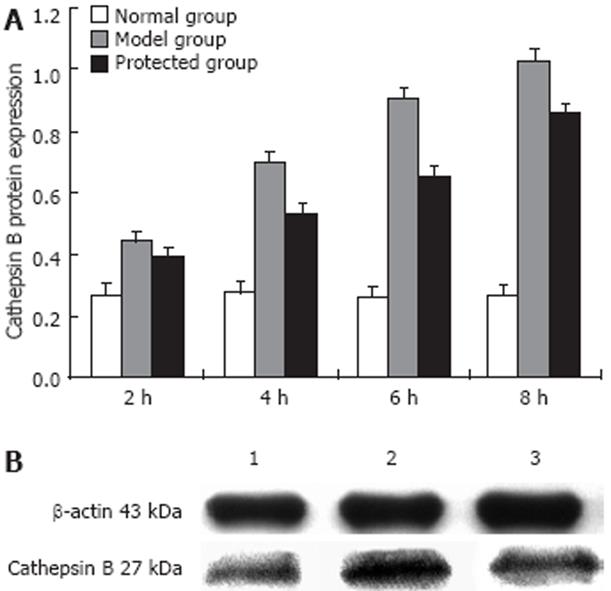
Figure 5 Western blot analysis of expression of cathepsin B protein in the normal, model and protected groups.
A: Expression of cathepsin B Protein in different groups; B: Expression of cathepsin B protein at 8 h; 1: Normal group; 2: Model group; 3: Protected group.
- Citation: Yan BZ, Wang W, Chen LY, Bi MR, Lu YJ, Li BX, Yang BS. Role of cathepsin B-mediated apoptosis in fulminant hepatic failure in mice. World J Gastroenterol 2009; 15(10): 1231-1236
- URL: https://www.wjgnet.com/1007-9327/full/v15/i10/1231.htm
- DOI: https://dx.doi.org/10.3748/wjg.15.1231


