Copyright
©2008 The WJG Press and Baishideng.
World J Gastroenterol. Feb 7, 2008; 14(5): 764-770
Published online Feb 7, 2008. doi: 10.3748/wjg.14.764
Published online Feb 7, 2008. doi: 10.3748/wjg.14.764
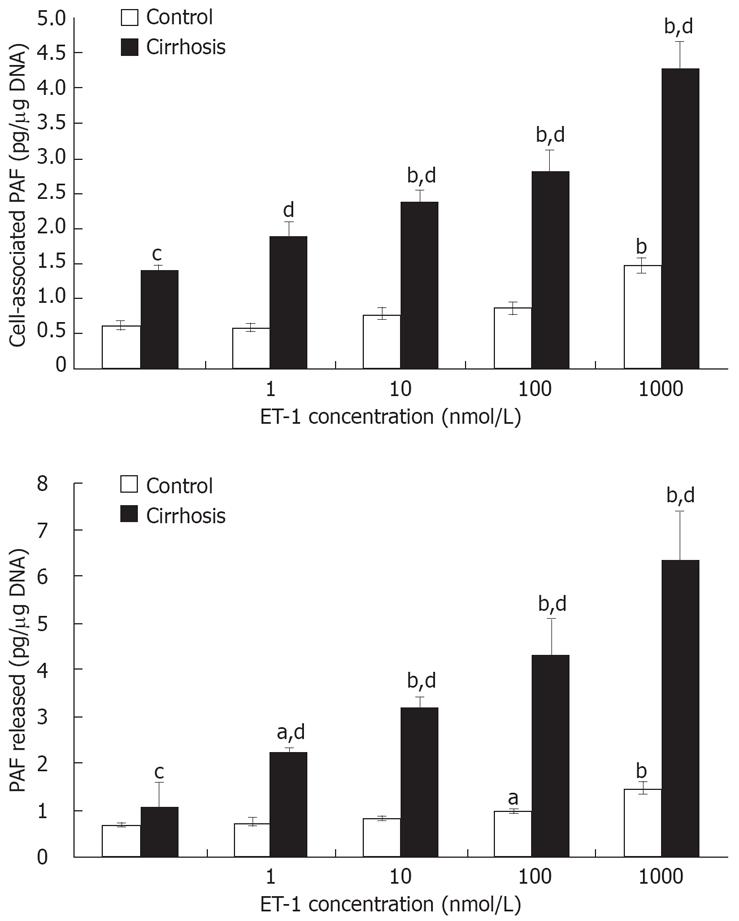
Figure 1 Effect of ET-1 on PAF synthesis in cultured activated Kupffer cells.
Kupffer cells from control and cirrhotic rats were cultured and stimulated with increasing concentrations of ET-1 for 15 min in serum-free medium. Cell-associated and released PAF levels were determined as explained in the Methods section. Each point represents an average of triplicate values ± SEM from a representative of two experiments. aP < 0.05 and bP < 0.01 vs vehicle; cP < 0.05 and dP < 0.01 vs control.
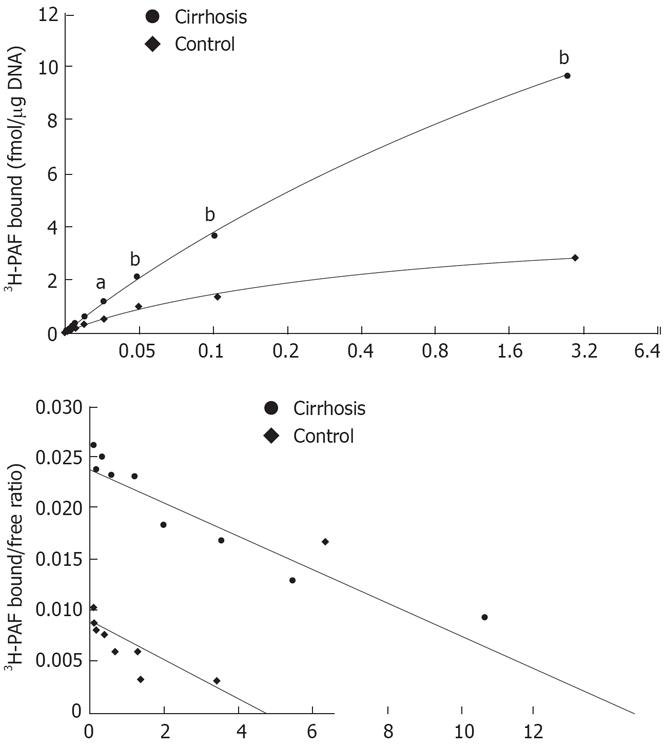
Figure 2 A: Saturation curve binding to cirrhotic and normal rat Kupffer cells.
Cells were used after overnight culture for receptor binding assay as described in the Method section. 3H-PAF at a concentration between 0.125 and 3.2 nmol/L was incubated with Kupffer cells in presence or absence of 5 &mgr;mol/L unlabeled PAF at 22°C for 3 h. aP < 0.05, bP < 0.01 vs control; B: Scattered blot analysis of 3H-PAF binding to cirrhotic and normal rat Kupffer cells. The results were analyzed by scatchard plot. Cirrhosis: R = 0.99, Kd = 2.08 nmol/L, Bax = 27.1882 ± 2.0885 fmol/mg. DNA; Control: R = 0.96, Kd = 1.57 nmol/L, Bax = 4.4024 ± 0.3155 fmol/mg. DNA.
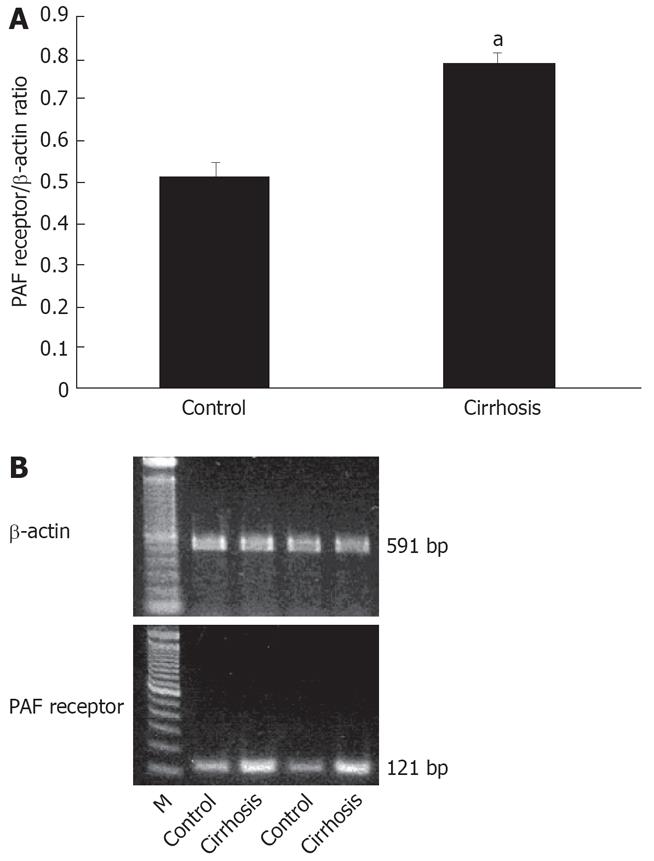
Figure 3 A: The mRNA expression of cirrhotic rat Kupffer cell PAF receptor.
Expression of β-actin mRNA (β-actin control: 90 311.14 ± 3882.67; cirrhosis: 110 958.2 ± 1484.58). aP < 0.05 vs control; B: Character of the PAF receptor expression in cirrhotic Kupffer cells. Total RNA was extracted from the cells for determination of PAF receptor mRNA expression by semiquantitative reverse transcriptase polymerase chain reaction assays as described in the Method section.
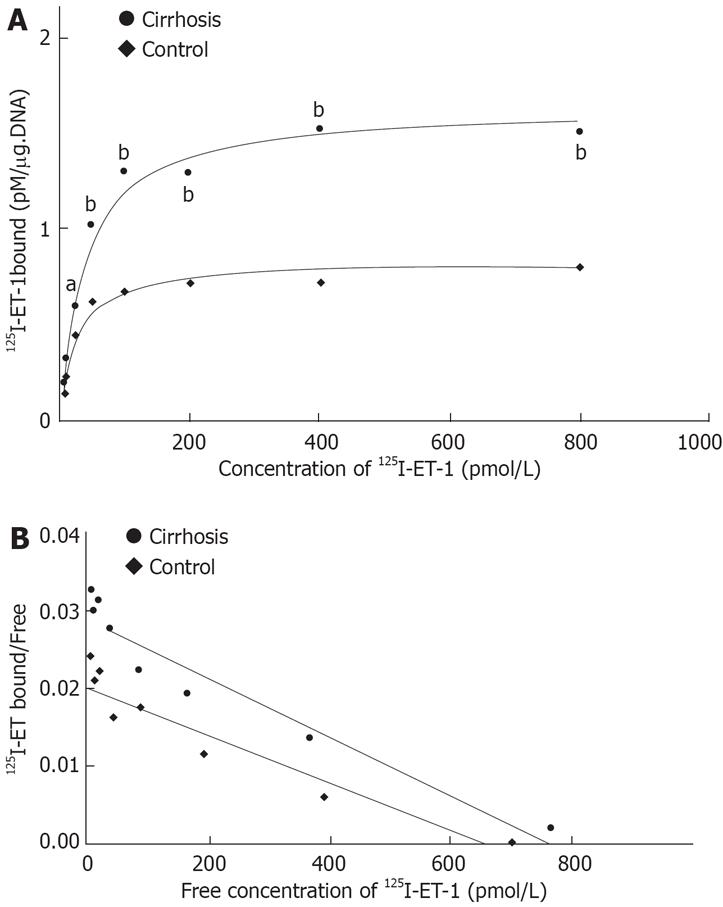
Figure 4 A: Saturation curve of 125I-ET-1 binding to cirrhotic and normal rat Kupffer cells.
125I-ET-1 at a concentration between 6.25-800 pmol/L was incubated with Kupffer cells (1 × 10⁶), in presence or absence of 2 &mgr;mol/L unlabeled ET-1 at 20°C for 3 h; B: Scattered blot analysis of 125I-ET-1 binding to cirrhotic and normal rat Kupffer cells. The result was analyzed by scatchard plot. Cirrhosis: R = 0.98, Kd = 37.72 pmol/L, Bax = 1639 ± 67.7 fmol/mg. DNA; Control: R = 0.94, Kd = 22.79 pmol/L, Bax = 820.4 ± 28.7 fmol/mg. DNA.
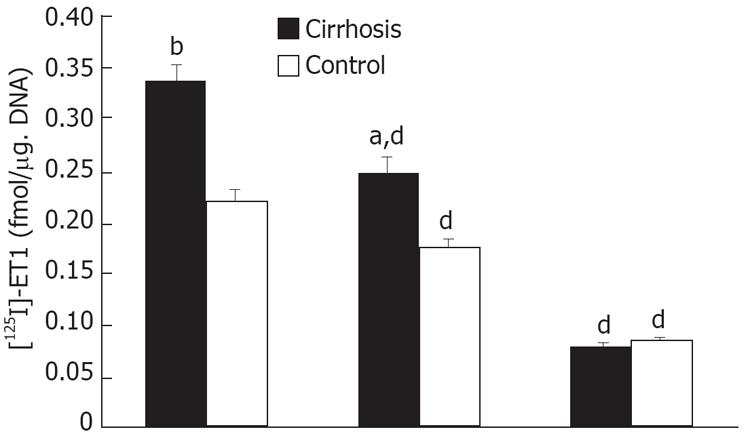
Figure 5 Competition binding assay (50 pmol/L 125I-ET-1 ± 1 &mgr;mol/L unlabelled ET-1, 5 &mgr;mol/L ETA antagonist BQ-123 or 5 &mgr;mol/L ETB antagonist BQ-788).
Specific binding of [125I]-ET-1 was different in cell-associated radioactivity in the presence and absence of 1 &mgr;mol/L unlabelled ET-1. aP < 0.05, bP < 0.01 vs control; dP < 0.01 vs [125I]-ET-1.
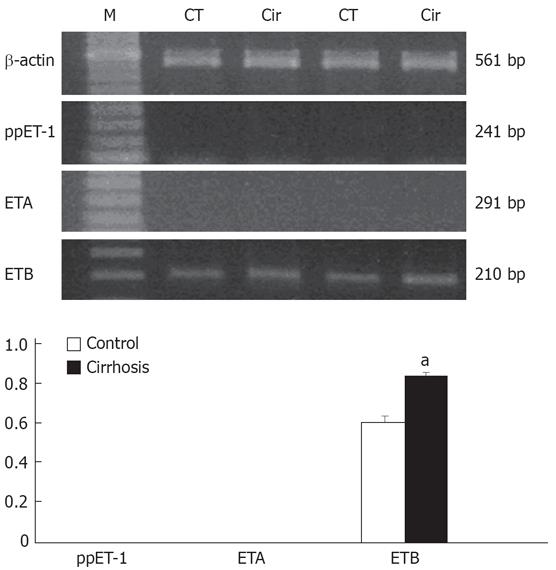
Figure 6 Characteristics of the preproendothelin-1 and ET-1 receptor subtype expression in the cirrhotic rat Kupffer cells.
RNA was extracted from the cells for determination of preproET-1 and ET-1 receptor subtypes mRNA expression by semi-quantitative reverse transcriptase polymerase chain reaction assay. Graphical presentation of data as standardized relative to expression of β-actin mRNA (β-actin control: 90 311.14 ± 3882.67; cirrhosis: 11 095.82 ± 1484.58). aP < 0.05 vs control.
- Citation: Lu YY, Wang CP, Zhou L, Chen Y, Su SH, Feng YY, Yang YP. Synthesis of platelet-activating factor and its receptor expression in Kupffer cells in rat carbon tetrachloride-induced cirrhosis. World J Gastroenterol 2008; 14(5): 764-770
- URL: https://www.wjgnet.com/1007-9327/full/v14/i5/764.htm
- DOI: https://dx.doi.org/10.3748/wjg.14.764


