Copyright
©2008 The WJG Press and Baishideng.
World J Gastroenterol. Nov 7, 2008; 14(41): 6355-6359
Published online Nov 7, 2008. doi: 10.3748/wjg.14.6355
Published online Nov 7, 2008. doi: 10.3748/wjg.14.6355
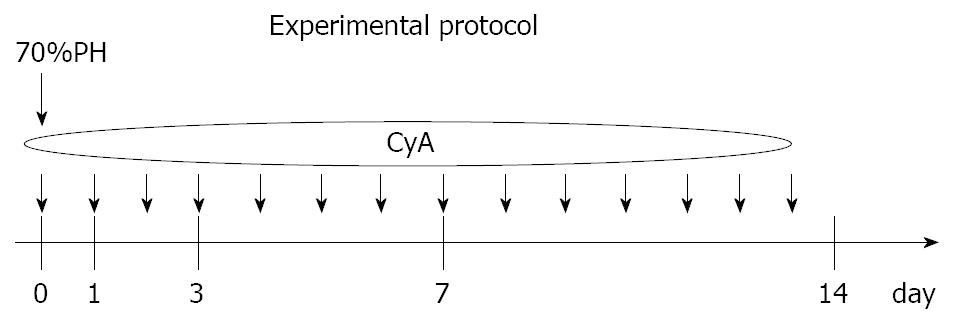
Figure 1 Administration schedule of CyA.
Rats underwent a 70% hepatectomy immediately followed by the daily administration of CyA for up to 14 d per os. Blood samples were collected on post operative day 1, 3, 7 and 14.
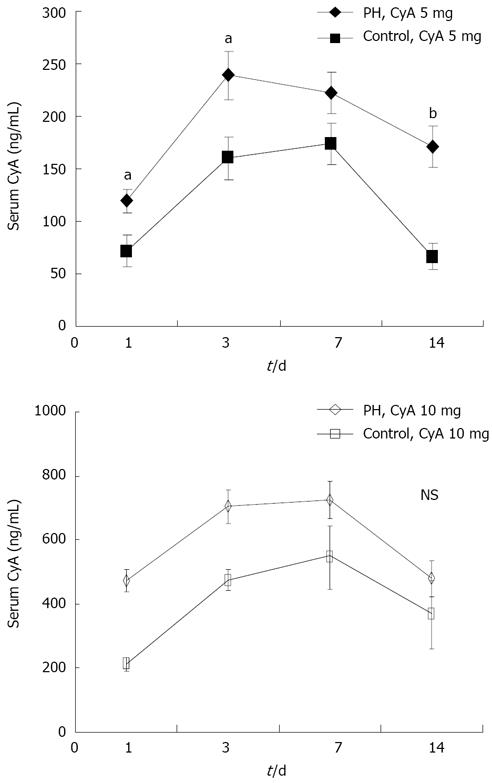
Figure 2 Changes in the serum concentration of CyA during liver regeneration.
The values are expressed as the mean ± SD of 5 samples in each group. The concentration of CyA reached a maximum during 3 to 7 d, and gradually declined thereafter. The level of CyA in the PH group was significantly higher than that in control group. aP < 0.05, bP < 0.01.
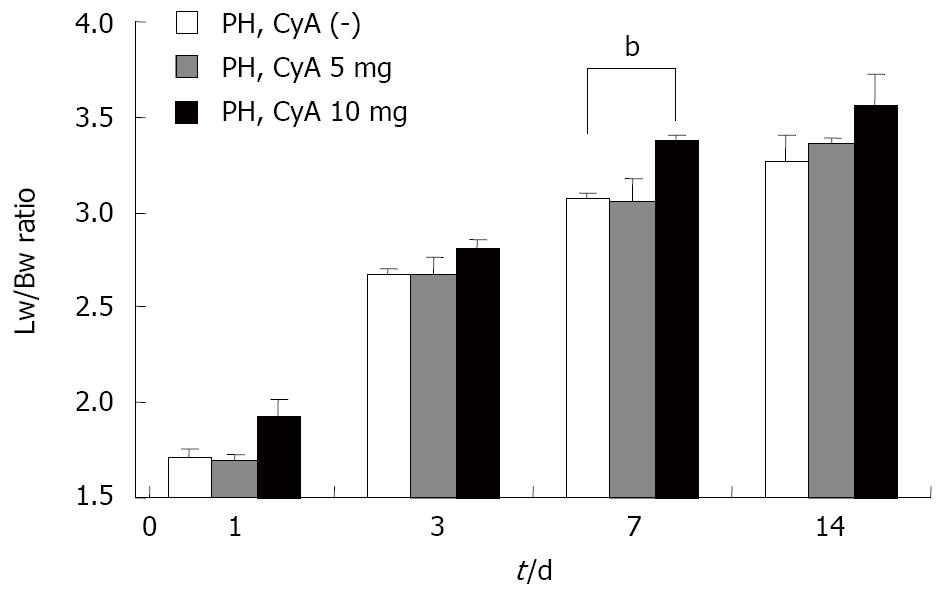
Figure 3 The effect of CyA on the liver regeneration ratio.
The values are expressed as the mean ± SE of 5 samples in each group. The low concentration of CyA (5 mg) did not affect the liver regeneration potential during the observation period; however, the rate of liver regeneration was significantly higher than that in the-low CyA group on postoperative day 7. bP < 0.01.
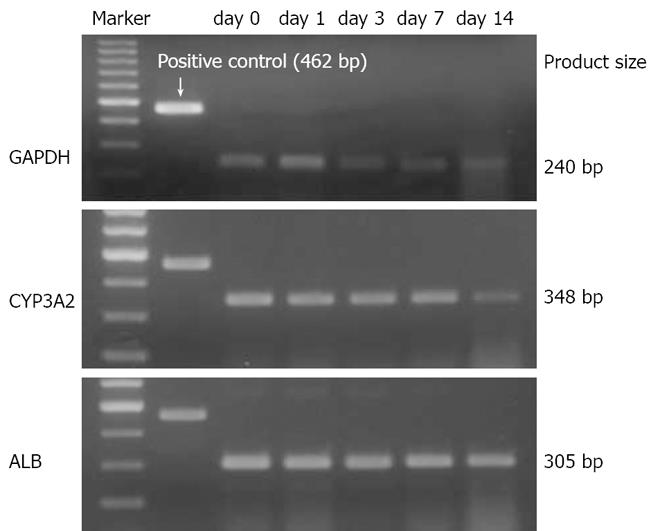
Figure 4 Changes of hepatocyte specific gene expression during liver regeneration.
Alb mRNA expression remained constant during liver regeneration, while the hepatocyte specific p450 activity-CYP3A2 significantly decreased on postoperative day 14.
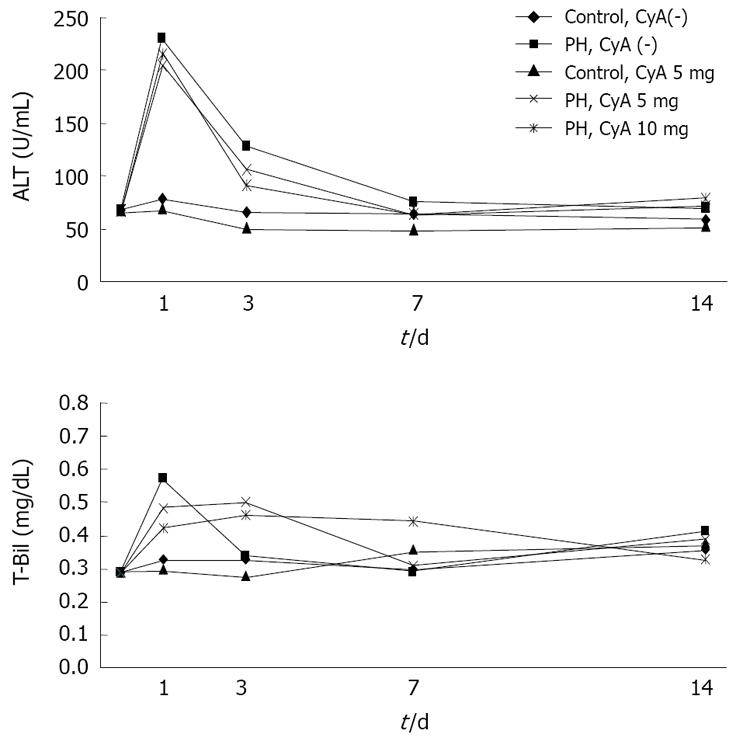
Figure 5 The effect of CyA on liver function.
Rats were anesthetized and blood samples were collected through the tail vein at the indicated time points. ALT and T-Bil level were measured as indicators of liver function. On day 1, ALT level were significantly increased and thereafter gradually reduced. There was no statistically significant difference in each group (P > 0.05).
- Citation: Nagayoshi S, Kawashita Y, Eguchi S, Kamohara Y, Takatsuki M, Miyamoto S, Mochizuki S, Soyama A, Tokai H, Hidaka M, Tajima Y, Kanematsu T. Metabolism for cyclosporin A during liver regeneration after partial hepatectomy in rats. World J Gastroenterol 2008; 14(41): 6355-6359
- URL: https://www.wjgnet.com/1007-9327/full/v14/i41/6355.htm
- DOI: https://dx.doi.org/10.3748/wjg.14.6355


