Copyright
©2008 The WJG Press and Baishideng.
World J Gastroenterol. Jan 28, 2008; 14(4): 590-594
Published online Jan 28, 2008. doi: 10.3748/wjg.14.590
Published online Jan 28, 2008. doi: 10.3748/wjg.14.590
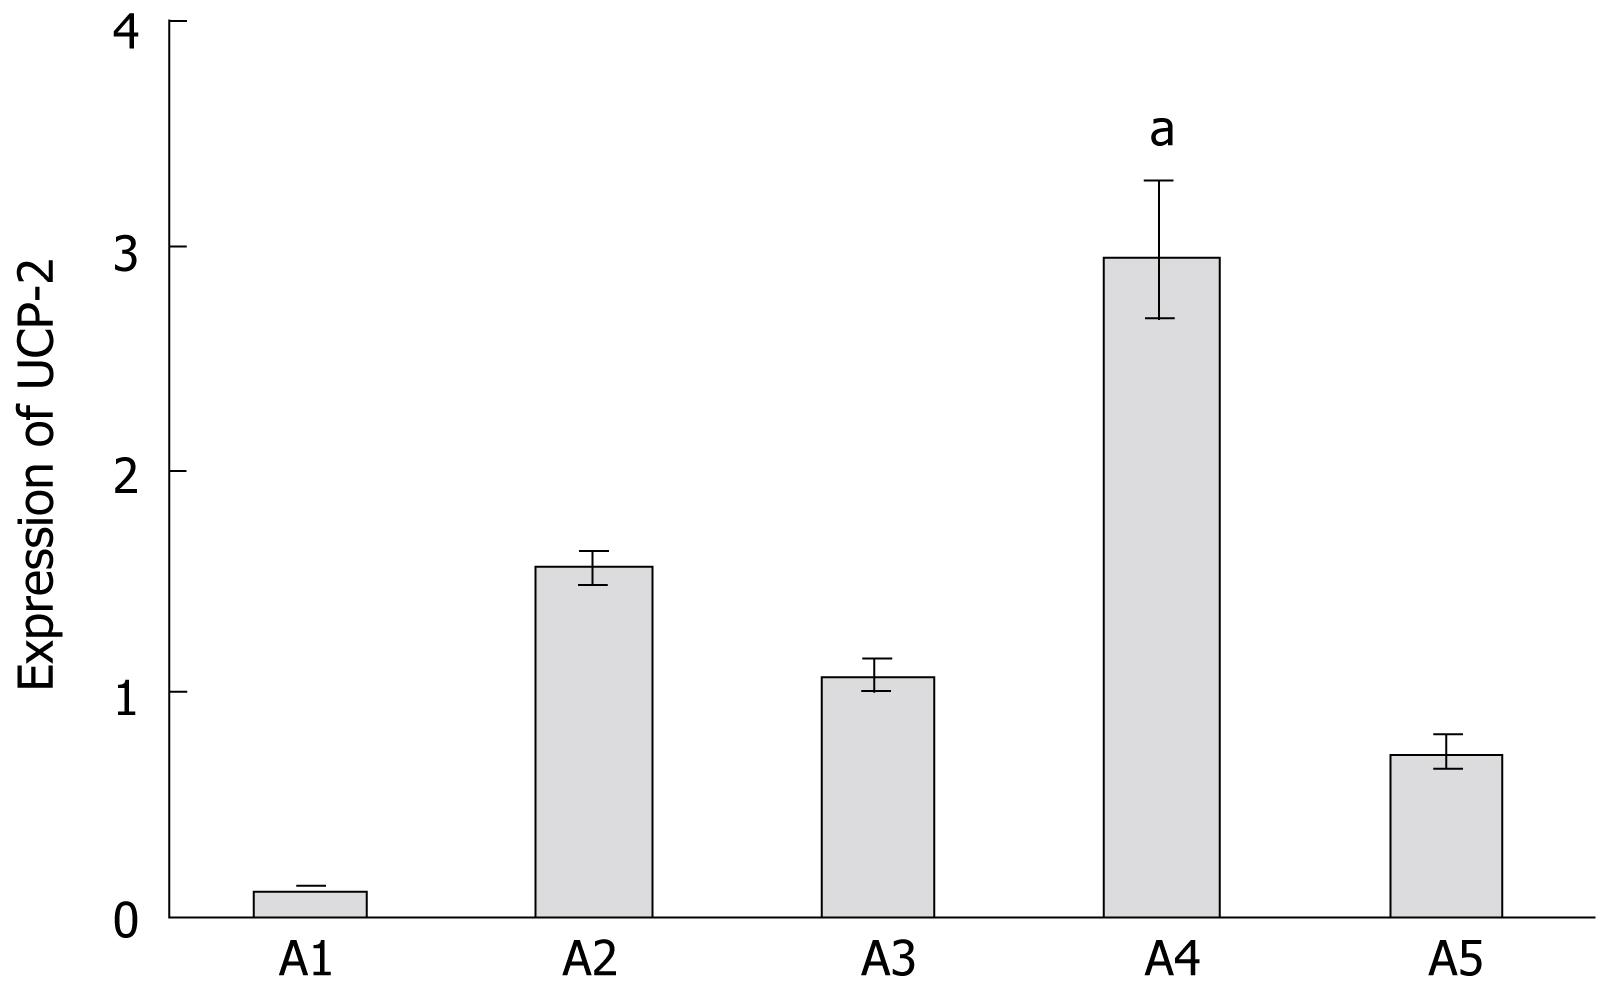
Figure 1 Expression levels of UCP-2 in cell culture.
aP < 0.05 vs A5.
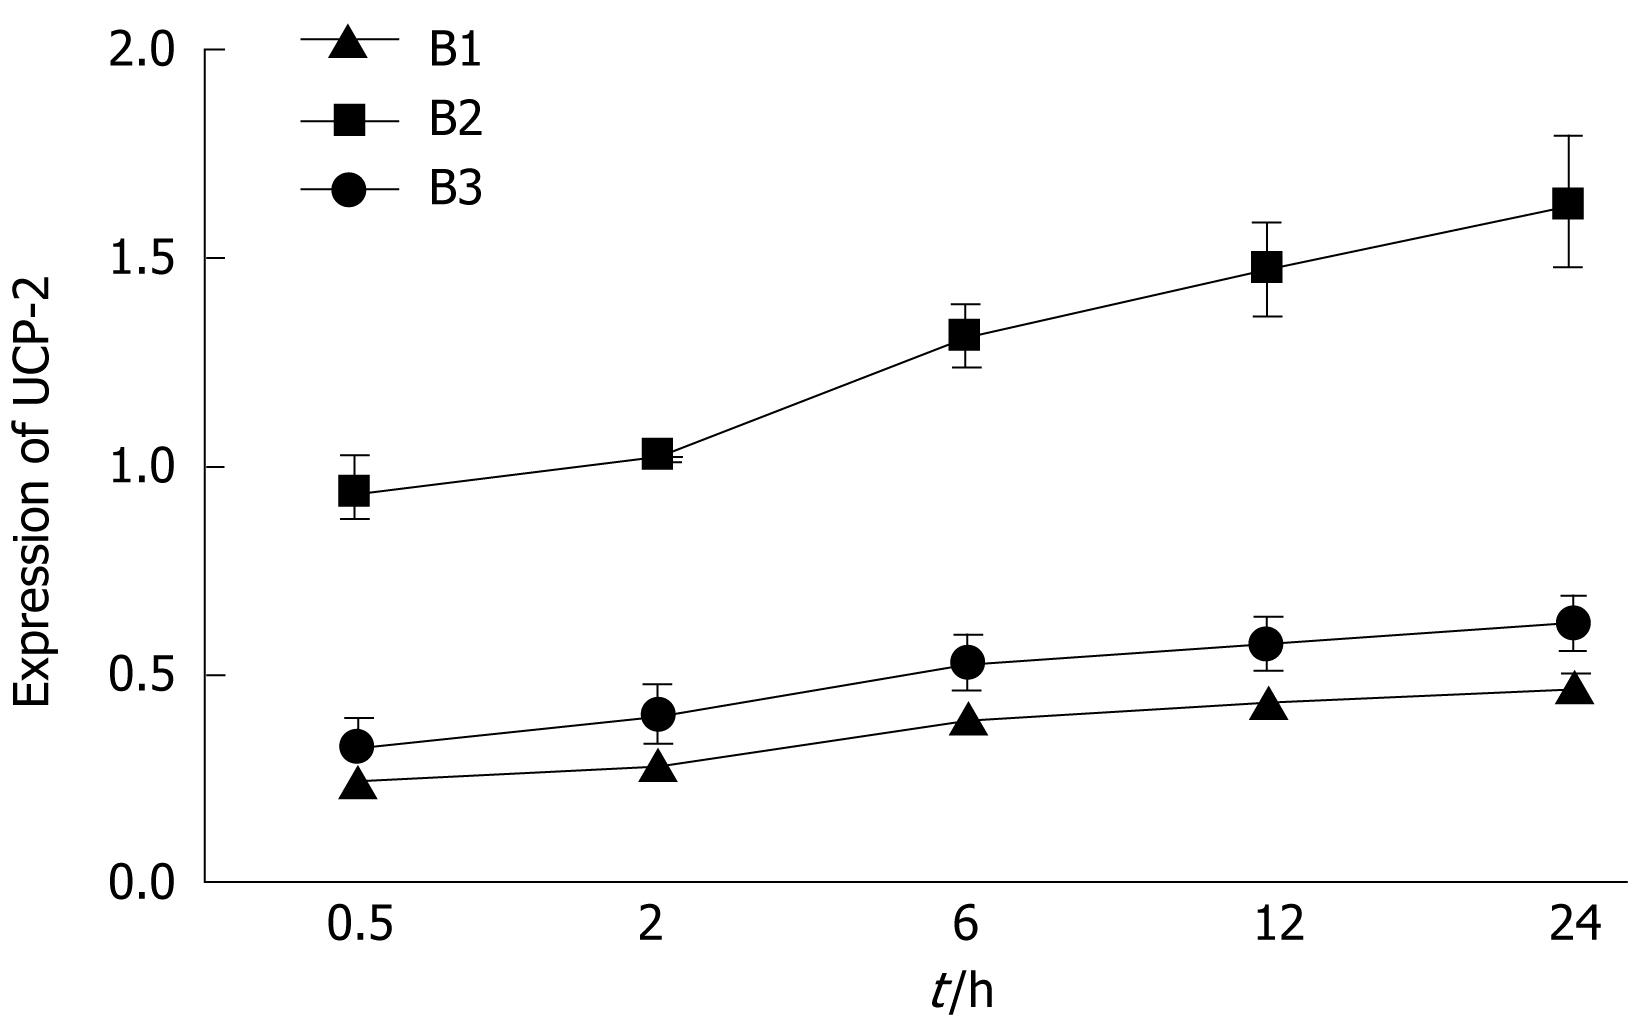
Figure 2 Expression levels of UCP-2 in I/R models.
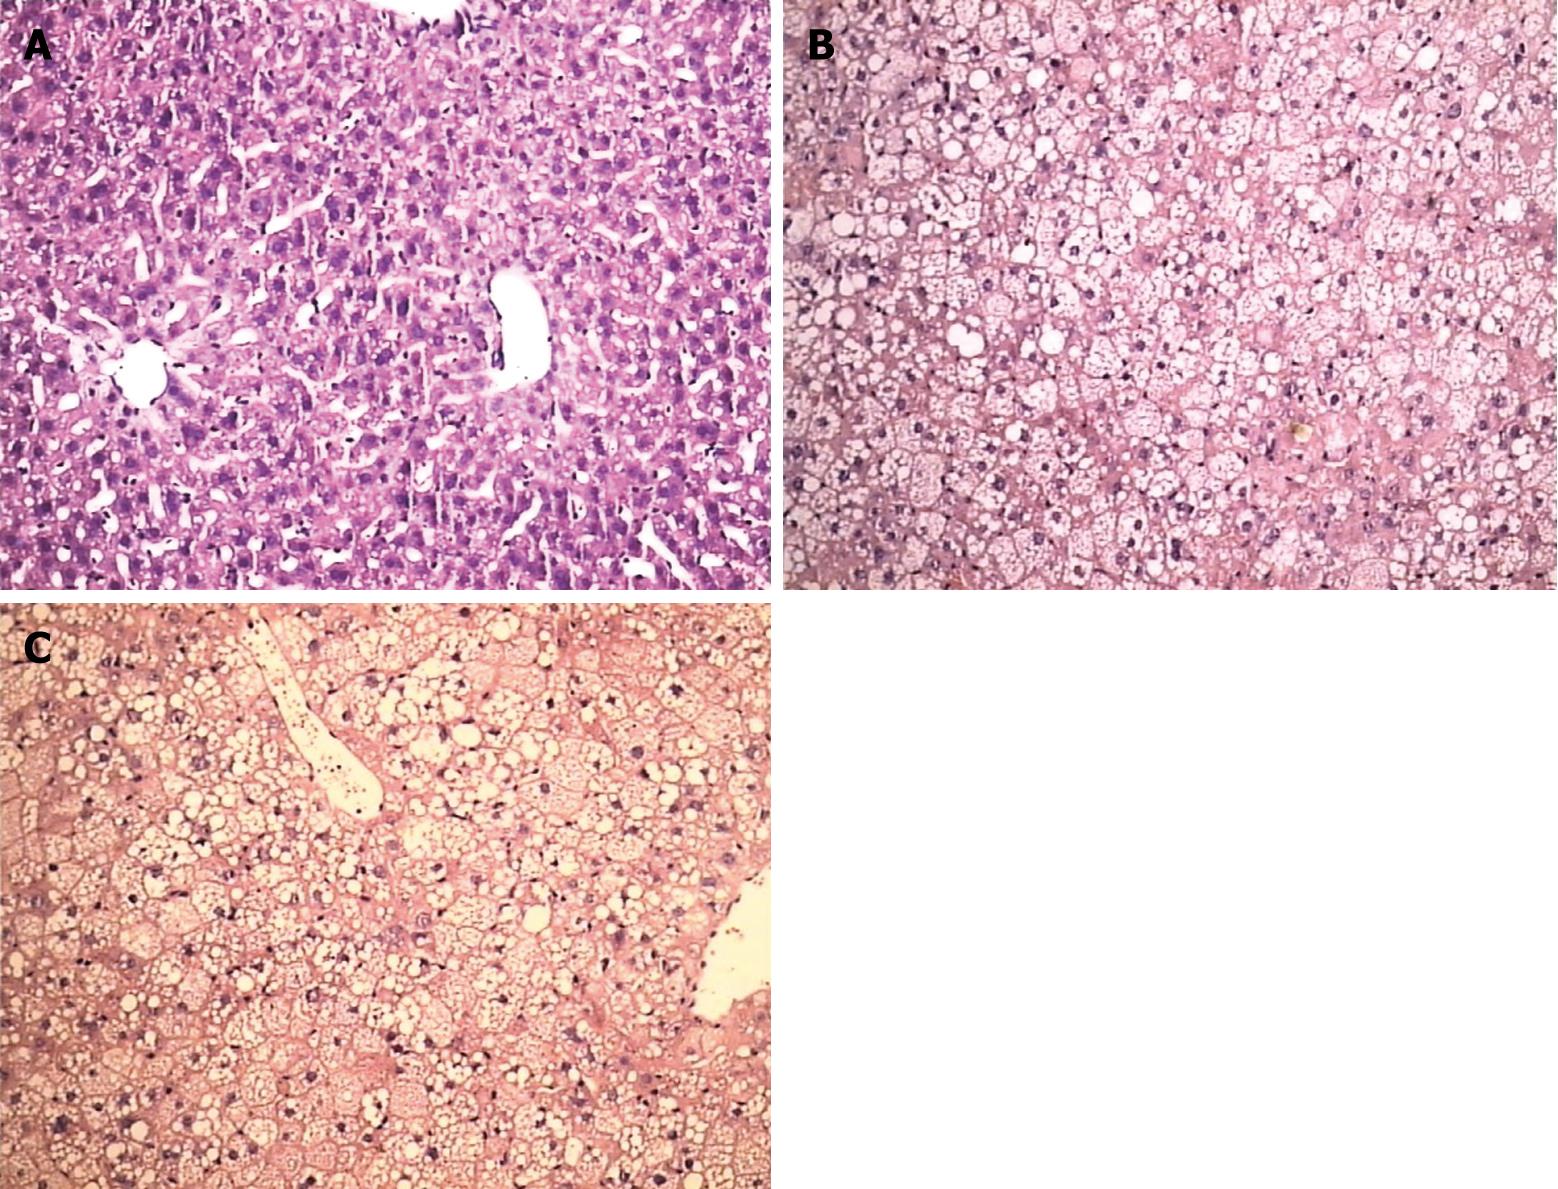
Figure 3 In the B1 group, swelling and hydropic degeneration of hepatocytes and hepatic sinusoid endothelial cells, stasis of hepatic sinusoids, and disorder of sinus funiculus were seen.
There was exfoliation of endothelial cells in the central vein, vacuolar degeneration of hepatocytes at the peripheral zone, and local necrosis in hepatic lobules and at the region adjacent to the portal area (HE, × 200); In the B2 group, the pathological changes in Figure 1 were aggravated, showing multiple local necrosis (HE, × 200); In the B3 group, the pathological changes in liver tissues were significantly alleviated as compared with those in B2 (Figure 3B).
- Citation: Wan CD, Wang CY, Liu T, Cheng R, Wang HB. Alleviation of ischemia/reperfusion injury in ob/ob mice by inhibiting UCP-2 expression in fatty liver. World J Gastroenterol 2008; 14(4): 590-594
- URL: https://www.wjgnet.com/1007-9327/full/v14/i4/590.htm
- DOI: https://dx.doi.org/10.3748/wjg.14.590


