Copyright
©2008 The WJG Press and Baishideng.
World J Gastroenterol. Oct 21, 2008; 14(39): 5996-6003
Published online Oct 21, 2008. doi: 10.3748/wjg.14.5996
Published online Oct 21, 2008. doi: 10.3748/wjg.14.5996
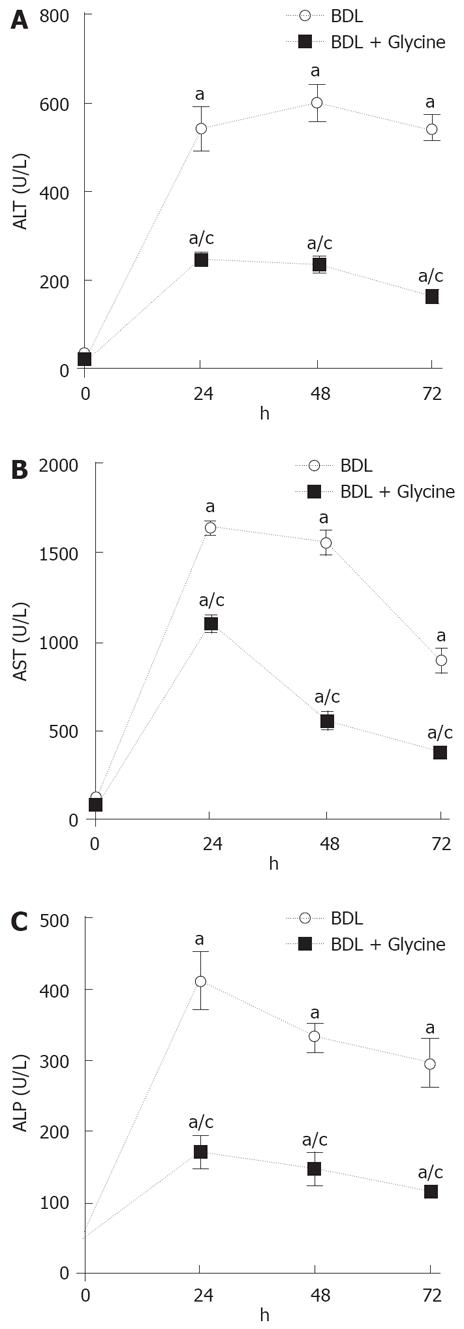
Figure 1 Dietary glycine blunts increased liver enzyme release after BDL.
Blood was collected at the time points indicated. Serum alanine aminotransferase (A), aspartate aminotransferase (B), and alkaline phosphatase (C) activity was determined using commercial kits. Values are mean ± SD (n = 5-6 in each group). aP < 0.05 vs sham operation; cP < 0.05 vs bile duct-ligated rats fed control diet.
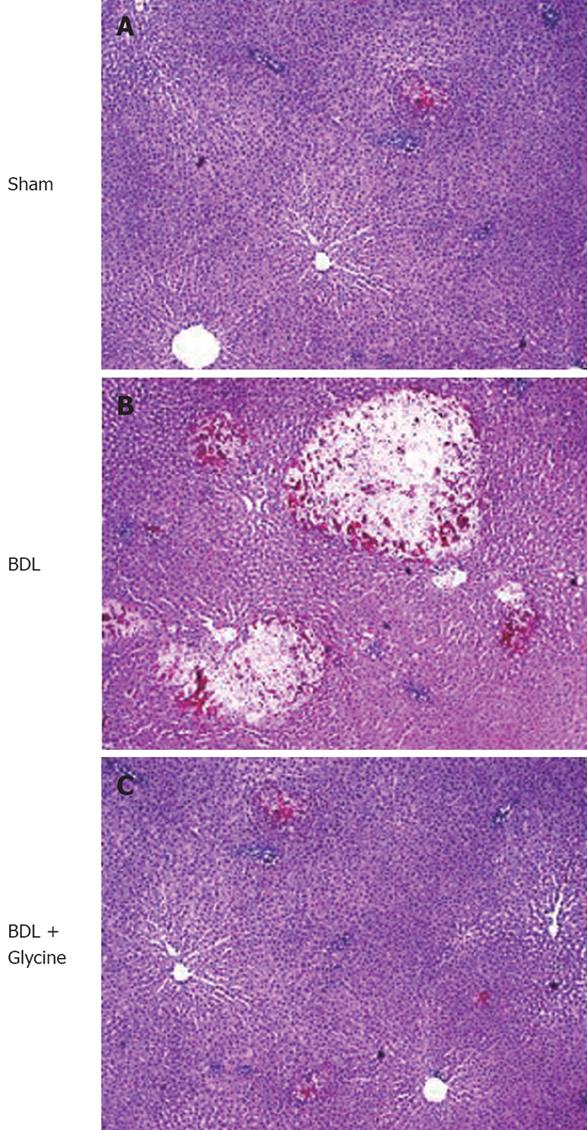
Figure 2 BDL induced focal necrosis that was blunted by dietary glycine.
Shown are representative images (× 75). A: Sham operation with control diet; B: BDL with control diet; C: BDL with dietary glycine.
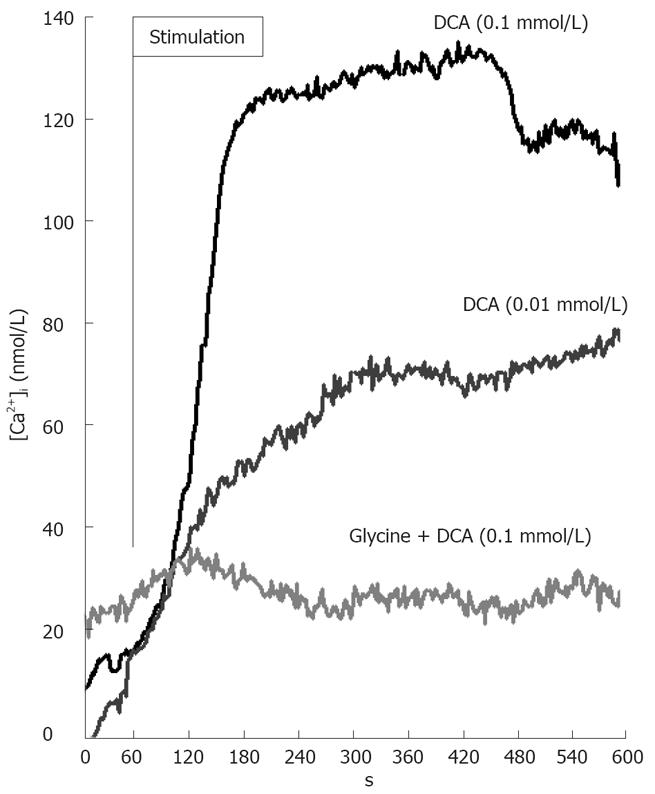
Figure 3 Glycine prevents DCA-induced rise of intracellular Ca2+ concentration ([Ca2+]i) in Kupffer cells.
[Ca2+]i was measured fluorometrically. Data are representative of 6 independent experiments.
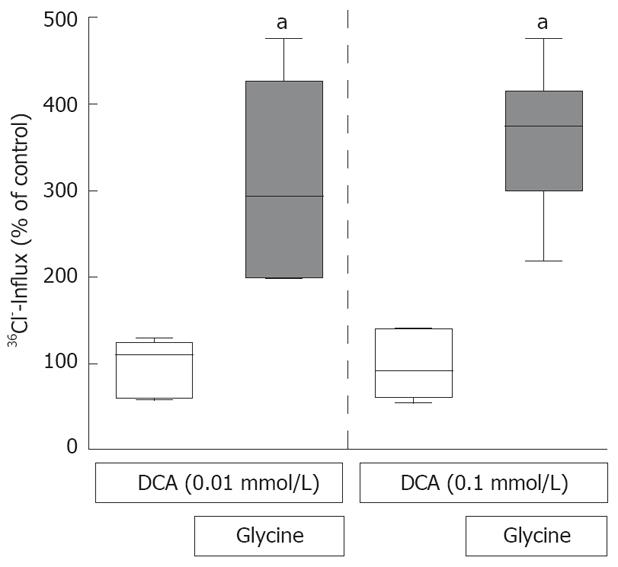
Figure 4 Glycine stimulates influx of radiolabeled chloride in Kupffer cells.
Data are expressed as % of control. Values are mean ± SD and are representative of at least 6 individual experiments. aP < 0.05 vs DCA (= control) group.
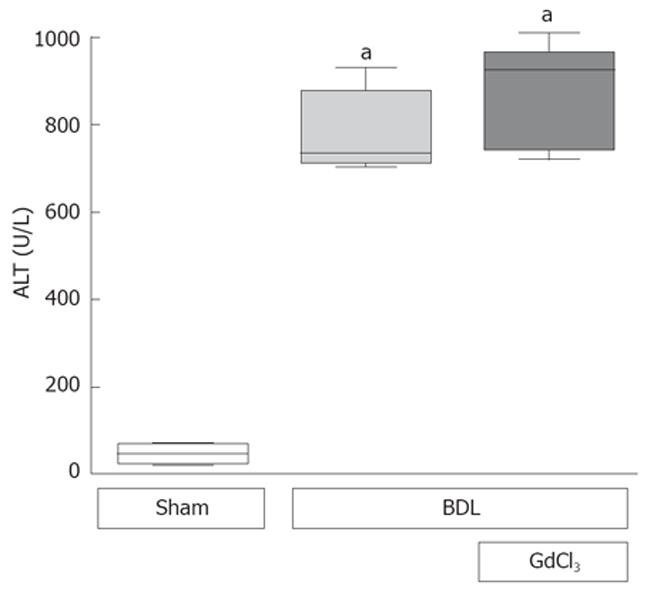
Figure 5 Elimination of Kupffer cells does not prevent elevated ALT release after BDL.
Rats were given gadolinium chloride (GdCl2; 20 mg/kg body weight) or saline 24 h before BDL or sham opration was performed. Values are mean ± SD (n = 5-6 in each group). aP < 0.05 vs sham-operated group.
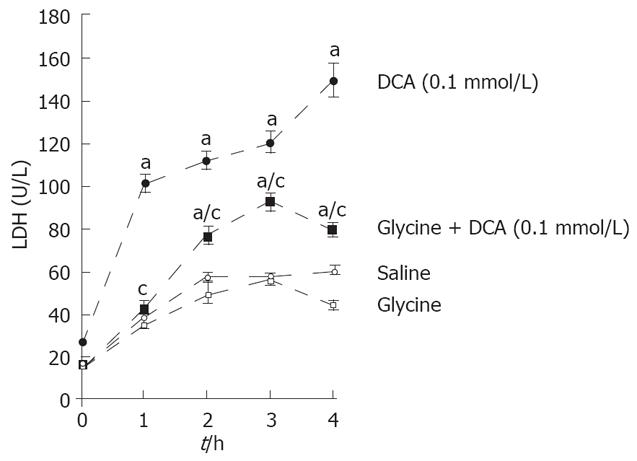
Figure 6 Glycine reduces DCA-induced release of LDH in isolated hepatocytes.
Cells were isolated and stimulated with DCA (0.1 mmol/L) or saline in the presence or absence of glycine (1 mmol/L). Values are mean ± SD (n = 5-6 in each group). aP < 0.05 vs saline or glycine group; cP < 0.05 vs DCA treated hepatocytes.
- Citation: Froh M, Zhong Z, Walbrun P, Lehnert M, Netter S, Wiest R, Conzelmann L, Gäbele E, Hellerbrand C, Schölmerich J, Thurman RG. Dietary glycine blunts liver injury after bile duct ligation in rats. World J Gastroenterol 2008; 14(39): 5996-6003
- URL: https://www.wjgnet.com/1007-9327/full/v14/i39/5996.htm
- DOI: https://dx.doi.org/10.3748/wjg.14.5996


