Copyright
©2008 The WJG Press and Baishideng.
World J Gastroenterol. Oct 21, 2008; 14(39): 5980-5989
Published online Oct 21, 2008. doi: 10.3748/wjg.14.5980
Published online Oct 21, 2008. doi: 10.3748/wjg.14.5980
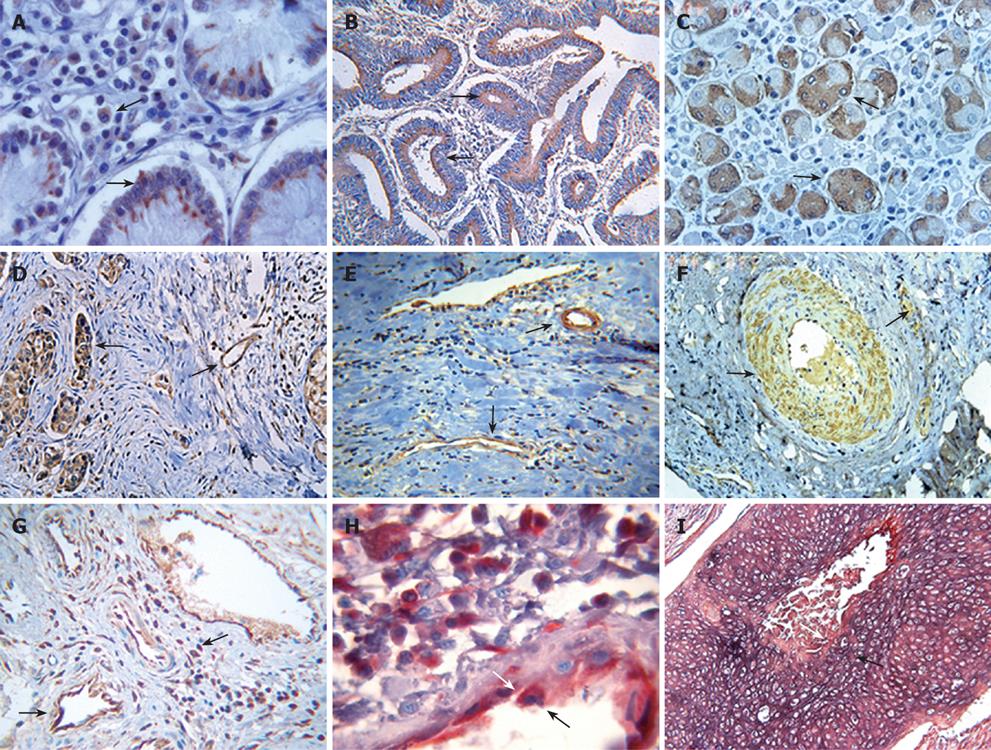
Figure 1 Immunohistochemical analysis of hfgl2 prothrombinase and fibrin in tumor tissues.
Fgl2 was verified by immunohistochemistry in colon cancer (A, × 400), esophageal cancer (B, × 200), gastric cancer (C, × 400), breast cancer (D, × 200), lung cancer (E, × 200) and cervix cancer (F, × 100). Fibrin deposition was stained for colon cancer (G, × 200). Dual staining of hfgl2 (indigo) and fibrin in colon cancer (H, × 1000) and cervix cancer (I, × 400) displayed the co-localization of hfgl2 (indigo) and fibrin (scarlet) expression. Cells expressed fgl2 protein and fibrin were detected with antibodies specific for fgl2 (black arrows) and fibrin (white arrow), respectively.
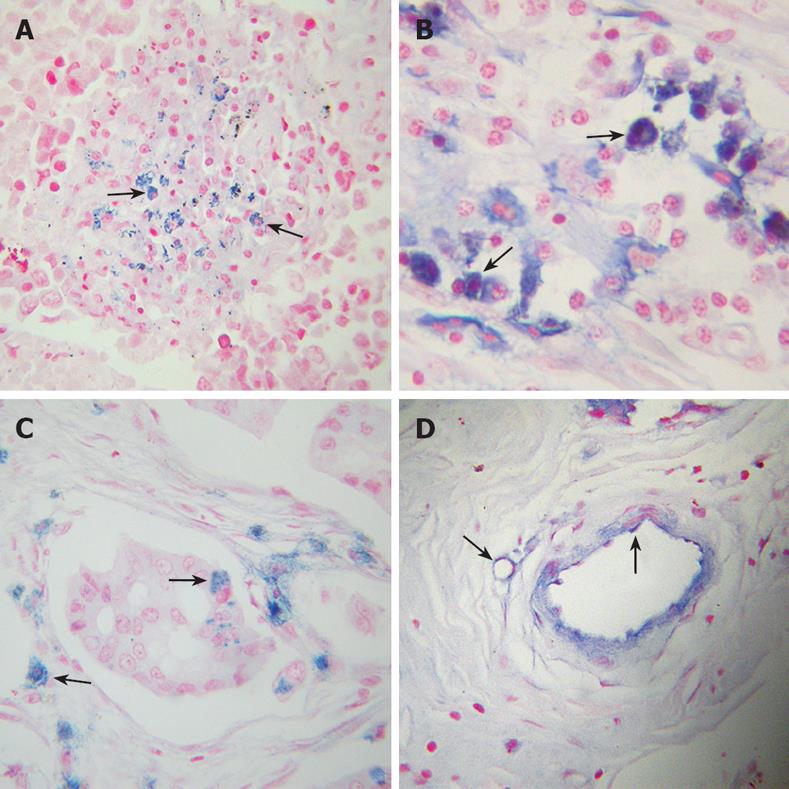
Figure 2 Hfgl2 mRNA detection in human tumor tissues by in situ hybridization.
A: Hfgl2 mRNA was stained purple in lung small cell carcinoma, hfgl2 mRNA present in the nests of tumor cells, some tumor cells secreted melanin (× 400); B: Submucosa of colon descendens tubular adenocarcinoma, hfgl2 mRNA present in the infiltrated cells and single migrating tumor cells (× 400); C: Invasive ductal breast carcinoma, hfgl2 mRNA localized to nest tumor cells, exfoliated tumor cells and infiltrated cells around the duct (× 400); D: Submucosa of gastric adenocarcinoma, hfgl2 mRNA localized to tumor blood vessel endothelium (× 400). Arrows indicate hfgl2 mRNA locations.
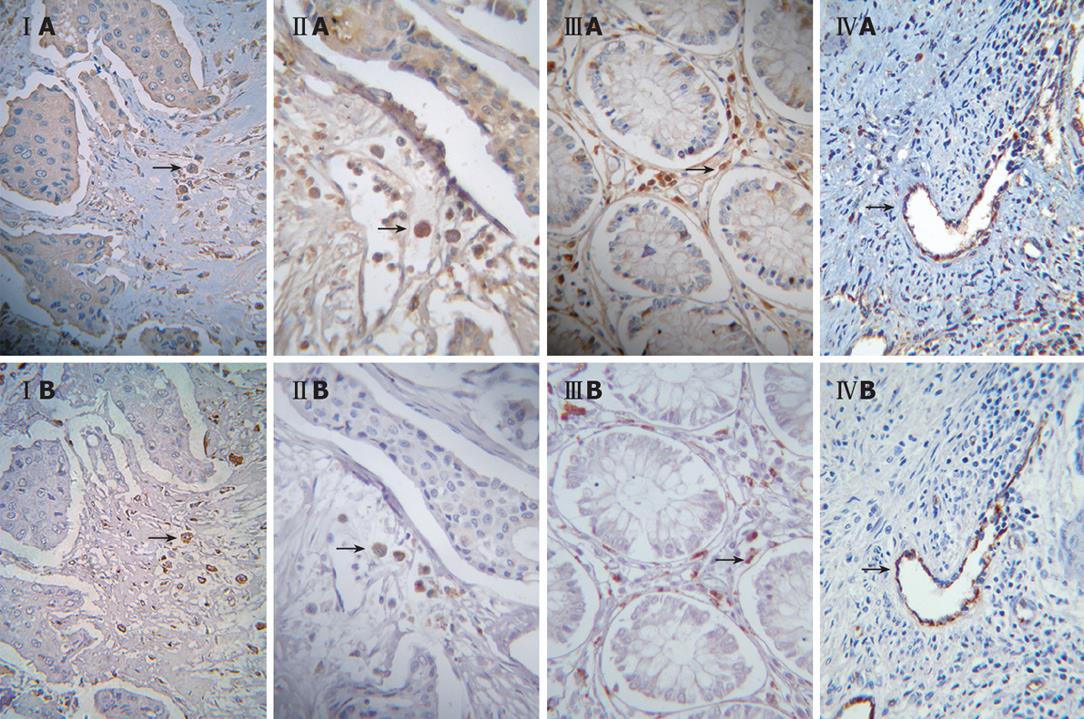
Figure 3 IA to IVA was stained with fgl2 antibody (black arrows) displaying the fgl2 protein in infiltrative cells.
IB to IVB was a serial section of IA to IVA, arrows indicate the staining of CD68, CD57, CD8 and vWF respectively.
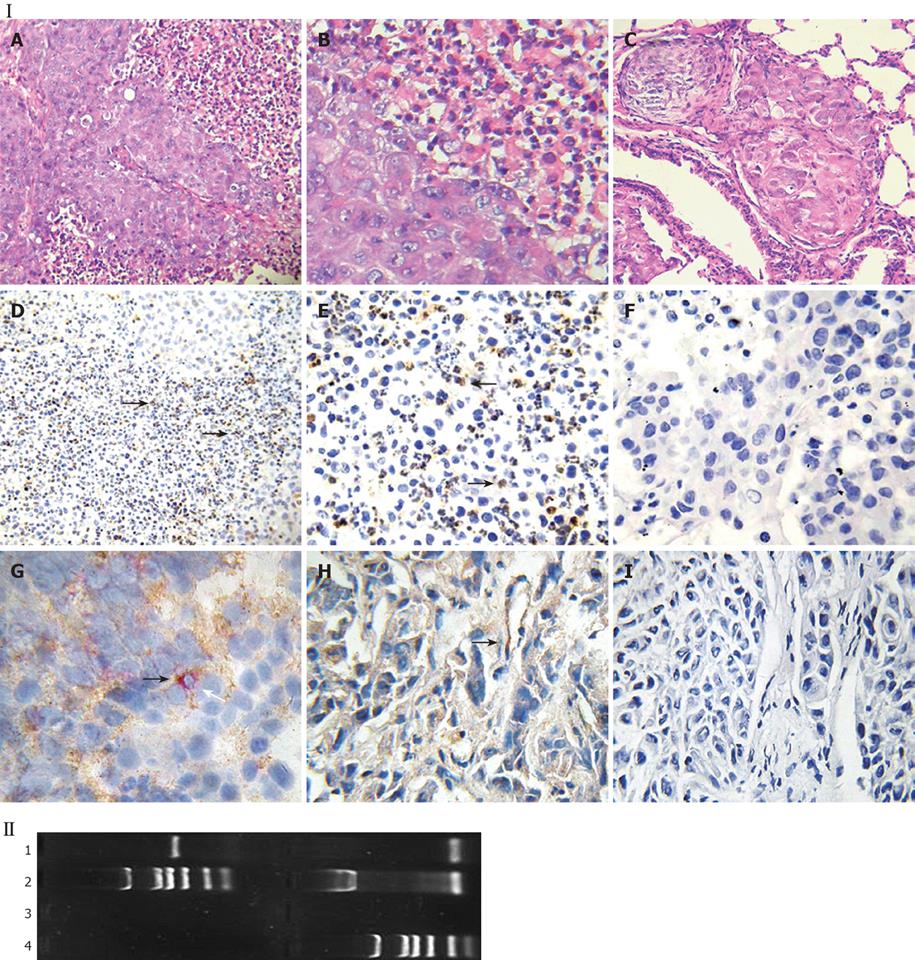
Figure 4 Fgl2 expression evidenced in mouse tumor tissue.
Male BALB/c-nu/nu mice were subcutaneously injected MHCC97LM6 cell lines and tumor tissues were harvested 36 d later. Panel I: A-C, HE staining in tumor tissue at injection site (A, × 200; B, × 400) and lung metastatic tumor tissue (C, × 200); D-I: mfgl2 expression in tumor tissue of human hepatocellular carcinoma (HCC) nude mice model (D, SP × 200; E, SP × 400; G, dual staining of mfgl2 and marker of macrophages; H, dual staining of mfgl2 and marker of endothelial cells; F and I, negative controls). Arrows in D and E indicate fgl2 positive cells, arrows in G and F indicate the fgl2 positive macrophage and endothelial cells, respectively. Panel II: mfgl2 mRNA expression in tumor tissue (1), PCDNA3.1-fgl2 plasmid as positive control (2), PCDNA3.1 as negative control (3) and DL-2000 marker (4).
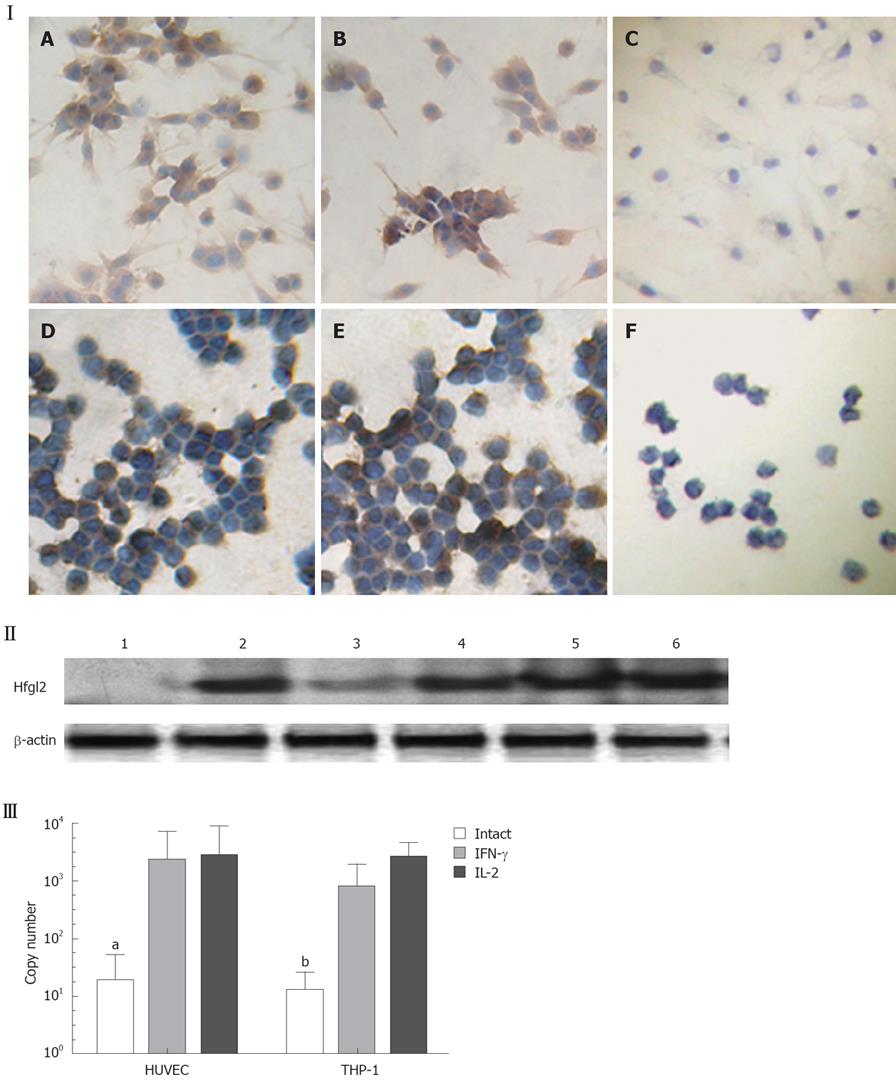
Figure 5 Increased expression of fgl2 after IFN-γ or IL-2 stimulation.
I: HUVEC and THP-1 cells were treated with IFN-γ (200 U/mL) and IL-2 (100 U/mL) and stained with antibodies specific for hfgl2. A: IFN-γ (200 U/mL, 12 h) + HUVEC (SP, × 200); B: IL-2 (100 U/mL, 8 h) + HUVEC (SP, × 200); C: NS +HUVEC (SP, × 200); D: IFN-γ (200 U/mL, 12 h) + THP-1 (SP, × 200); E: IL-2 (100 U/mL, 8 h) + THP-1(SP, × 200); F: NS + THP-1 (SP, × 200). II: Western blotting analysis of hfgl2 expression after IFN-γ (200 U/mL) and IL-2 (100 U/mL) stimulation for 12 h and 8 h on HUVEC and THP-1 cells. 1: Intact HUVEC; 2: IFN-γ + HUVEC; 3: Intact THP-1; 4: IFN-γ + THP-1; 5: IL-2 + HUVEC; 6: IL-2 +THP-1. III: Real-time PCR analysis of inducible hfgl2 mRNA after stimulation for 4 h. aP = 0.0329, vs HUVEC alone; bP = 0.0059, vs THP-1 alone.
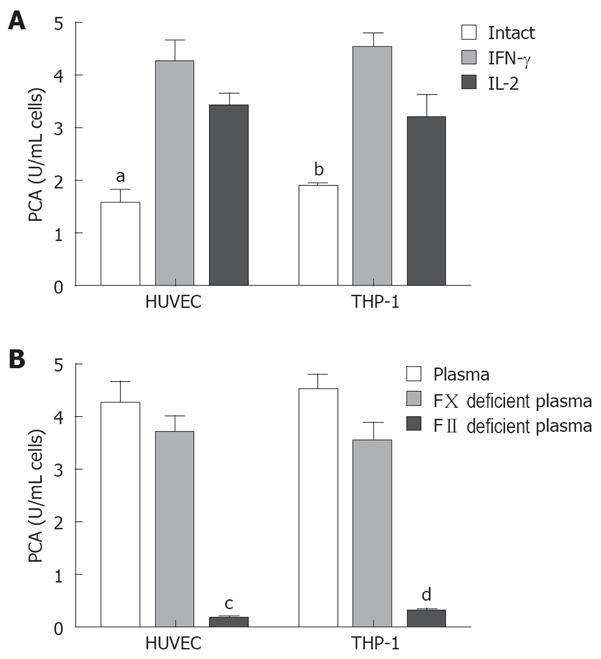
Figure 6 Increase of procoagulant activity (PCA) in HUVEC and THP-1 cells after IFN-γ and IL-2 stimulation dependent on FII but not FX.
HUVEC and THP-1 cells received IFN-γ (200 U/mL) and IL-2 (100 U/mL) for 12 h and the PCA was assayed. IFN-γ and IL-2 increased PCA and this effect is preserved in FX poor plasma whereas is absent in FII poor plasma. aP = 0.0026, vs HUVEC alone; bP = 0.0037, vs THP-1 alone; cP = 0.0002, FII deficient plasma group vs normal plasma group or FX deficient plasma group; dP = 0.0001, FII deficient plasma group vs normal plasma group or FX deficient plasma group.
-
Citation: Su K, Chen F, Yan WM, Zeng QL, Xu L, Xi D, Pi B, Luo XP, Ning Q. Fibrinogen-like protein 2/fibroleukin prothrombinase contributes to tumor hypercoagulability
via IL-2 and IFN-γ. World J Gastroenterol 2008; 14(39): 5980-5989 - URL: https://www.wjgnet.com/1007-9327/full/v14/i39/5980.htm
- DOI: https://dx.doi.org/10.3748/wjg.14.5980


