Copyright
©2008 The WJG Press and Baishideng.
World J Gastroenterol. Sep 21, 2008; 14(35): 5403-5411
Published online Sep 21, 2008. doi: 10.3748/wjg.14.5403
Published online Sep 21, 2008. doi: 10.3748/wjg.14.5403
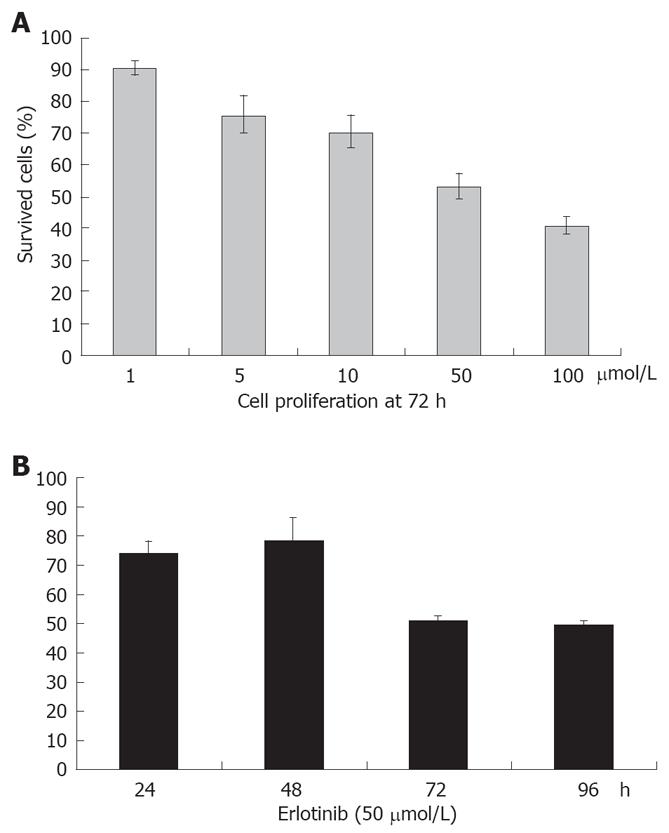
Figure 1 A: Growth percentage of BxPC-3 cell line after 72 h of exposure to erlotinib at varying concentrations ranging from 1-100 μmol/L.
BxPC cell proliferation was significantly suppressed by erlotinib at different concentrations; B: Growth percentage of BxPC-3 cell line after exposure to erlotinib at a concentration of 50 μmol/L at different time points.
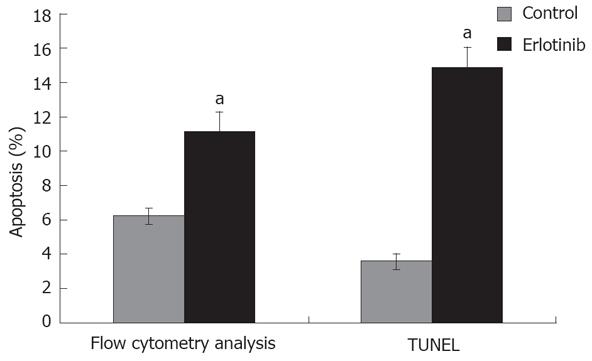
Figure 2 Induction of apoptosis in BxPC-3 cell line.
There was a significant apoptosis in erlotinib treated group both in flow cytometry analysis and TUNEL assay after 48 h treatment (aP < 0.05).
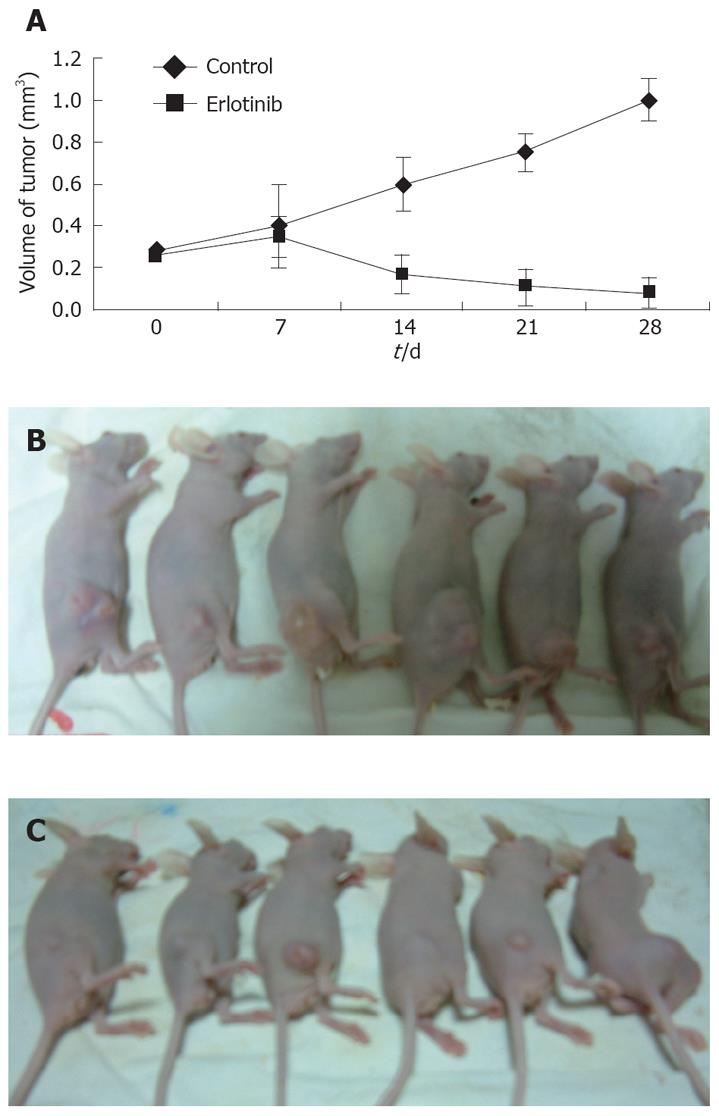
Figure 3 A: Effect of erlotinib on mean tumor volume in the BxPC-3 xenograft model.
Mice were implanted with BxPC-3 cells. When palpable tumors were established, animals were randomly divided into two groups. The animals were continuously gavaged with the agents for 4 wk as described in Matericals and Methods. Tumor size was measured twice per week. Values are means, n = 6. B: Mice of control group; C: Mice of erlotinb group.
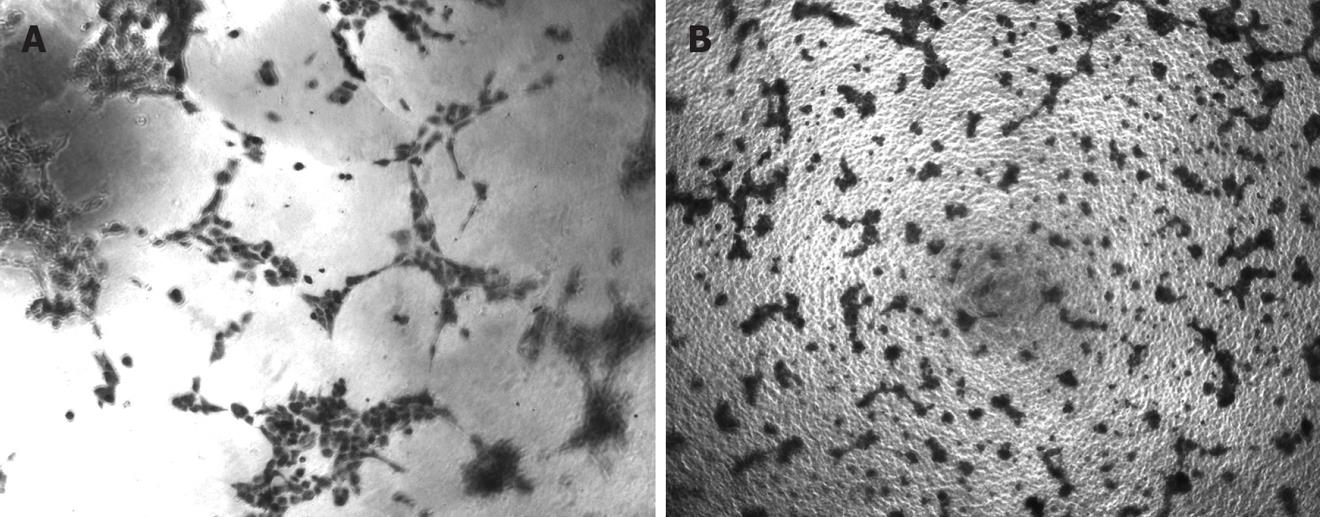
Figure 4 Effects of erlotinib on capillary formation by ECV304 were examined in vitro.
A: When cultured on ECMatrix, ECV304 cells rapidly aligned with hollow tube-like structures; B: ECV304 cells were treated with erlotinib (100 μmol/L), and significant inhibition of tube formation was achieved compared with the control.
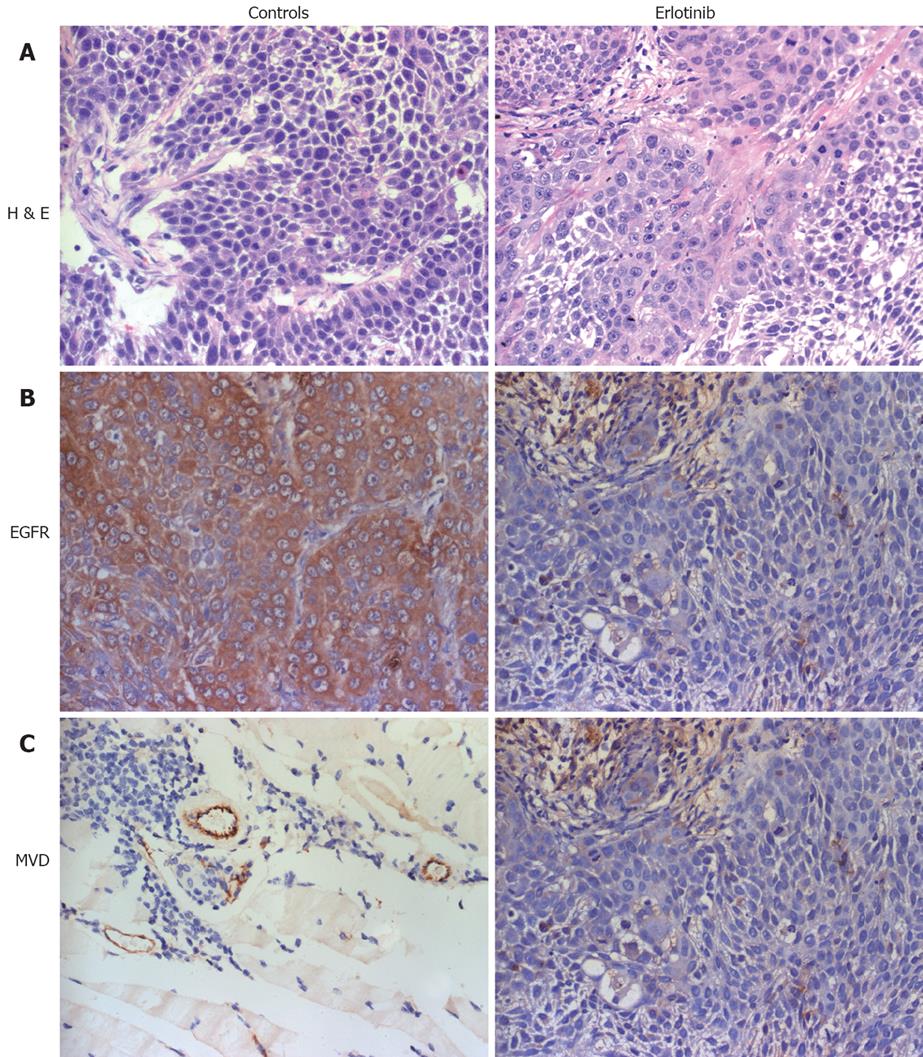
Figure 5 Expression of EGFR and the blood vessel endothelial cells in different treatment group in BxPC-3 mouse xenograft tissues.
IHC was used to determine expression levels of EGFR and evaluate tumor microvessel density. A: HE staining for each sample (× 400); B: Expression of EGFR in treatment group was decreased compared with the control (× 400); C: Microvessel density of erlotinib treated group was lower than that of the control group.
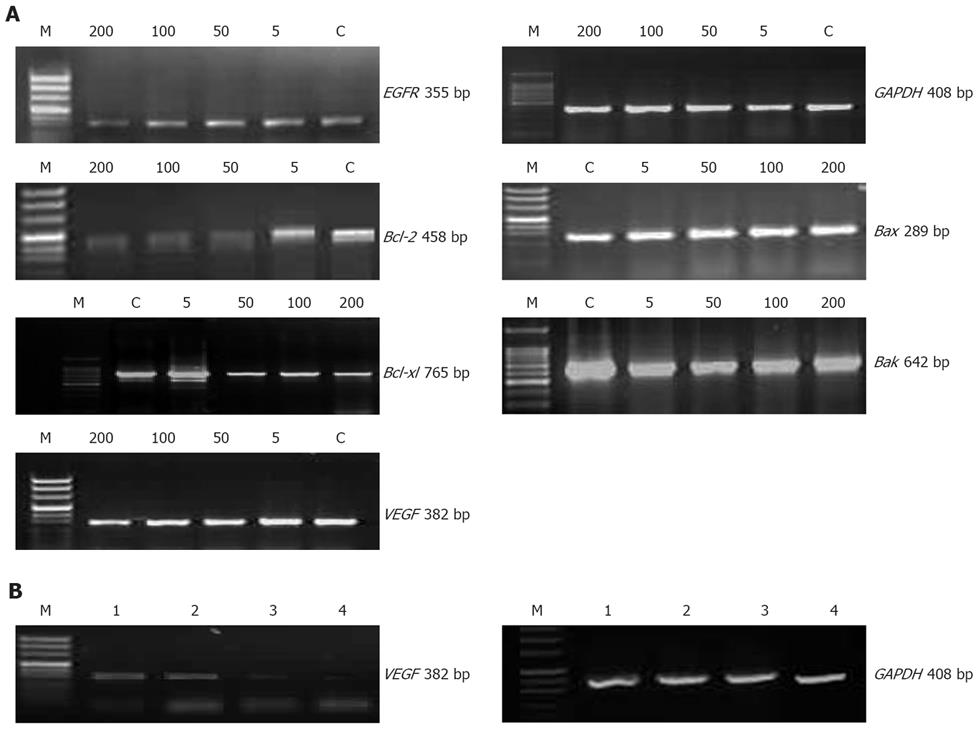
Figure 6 Expressions of EGFR, Bcl-2, Bcl-xl, Bax, Bak and VEGF mRNA in BxPC-3 cells treated with different concentrations (μmol/L) of erlotinib for 48 h and xenograft tissues were detected by RT-PCR.
A: Effects of erlotinib on the expressions of EGFR, apoptosis-associated factors and VEGF. Lane M: DNA marker; Lane C: Control; other lanes: Different concentrations of erlotinib. B: Effects of erlotinib (100 mg/kg daily) on expression of VEGF in tumor tissues. Lane M: DNA marker; Lane 1, 2: Control group; Lane 3, 4: Treatment group. RT-PCR for GAPDH was performed in parallel and showed an equal amount of total RNA in the sample.
- Citation: Lu YY, Jing DD, Xu M, Wu K, Wang XP. Anti-tumor activity of erlotinib in the BxPC-3 pancreatic cancer cell line. World J Gastroenterol 2008; 14(35): 5403-5411
- URL: https://www.wjgnet.com/1007-9327/full/v14/i35/5403.htm
- DOI: https://dx.doi.org/10.3748/wjg.14.5403


