Copyright
©2008 The WJG Press and Baishideng.
World J Gastroenterol. Jan 21, 2008; 14(3): 435-440
Published online Jan 21, 2008. doi: 10.3748/wjg.14.435
Published online Jan 21, 2008. doi: 10.3748/wjg.14.435
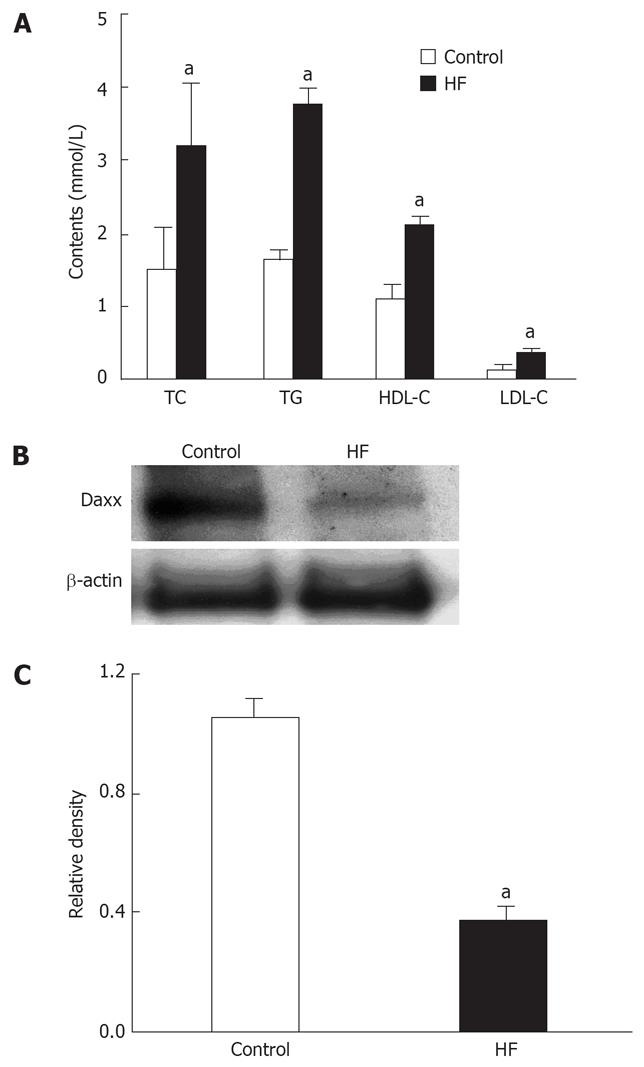
Figure 1 The correlation between Daxx expression of Hepatic tissues and serum cholesterol.
A: The effect of control or high fat (HF) food on serum cholesterol and triglycerides in rats; B: Hepatic Daxx expression of rats as estimated by western blotting; C: Quantitative data of Daxx expression, results were normalized to β-actin. Data are the mean ± SE of three independent experiments. Control: normal food. HF: Added high fat to normal food. TC: Total cholesterol; TG: Triglyceride; LDL-C: Low-density lipoprotein cholesterol; HDL-C: High-density lipoprotein cholesterol. aP < 0.05 vs control.
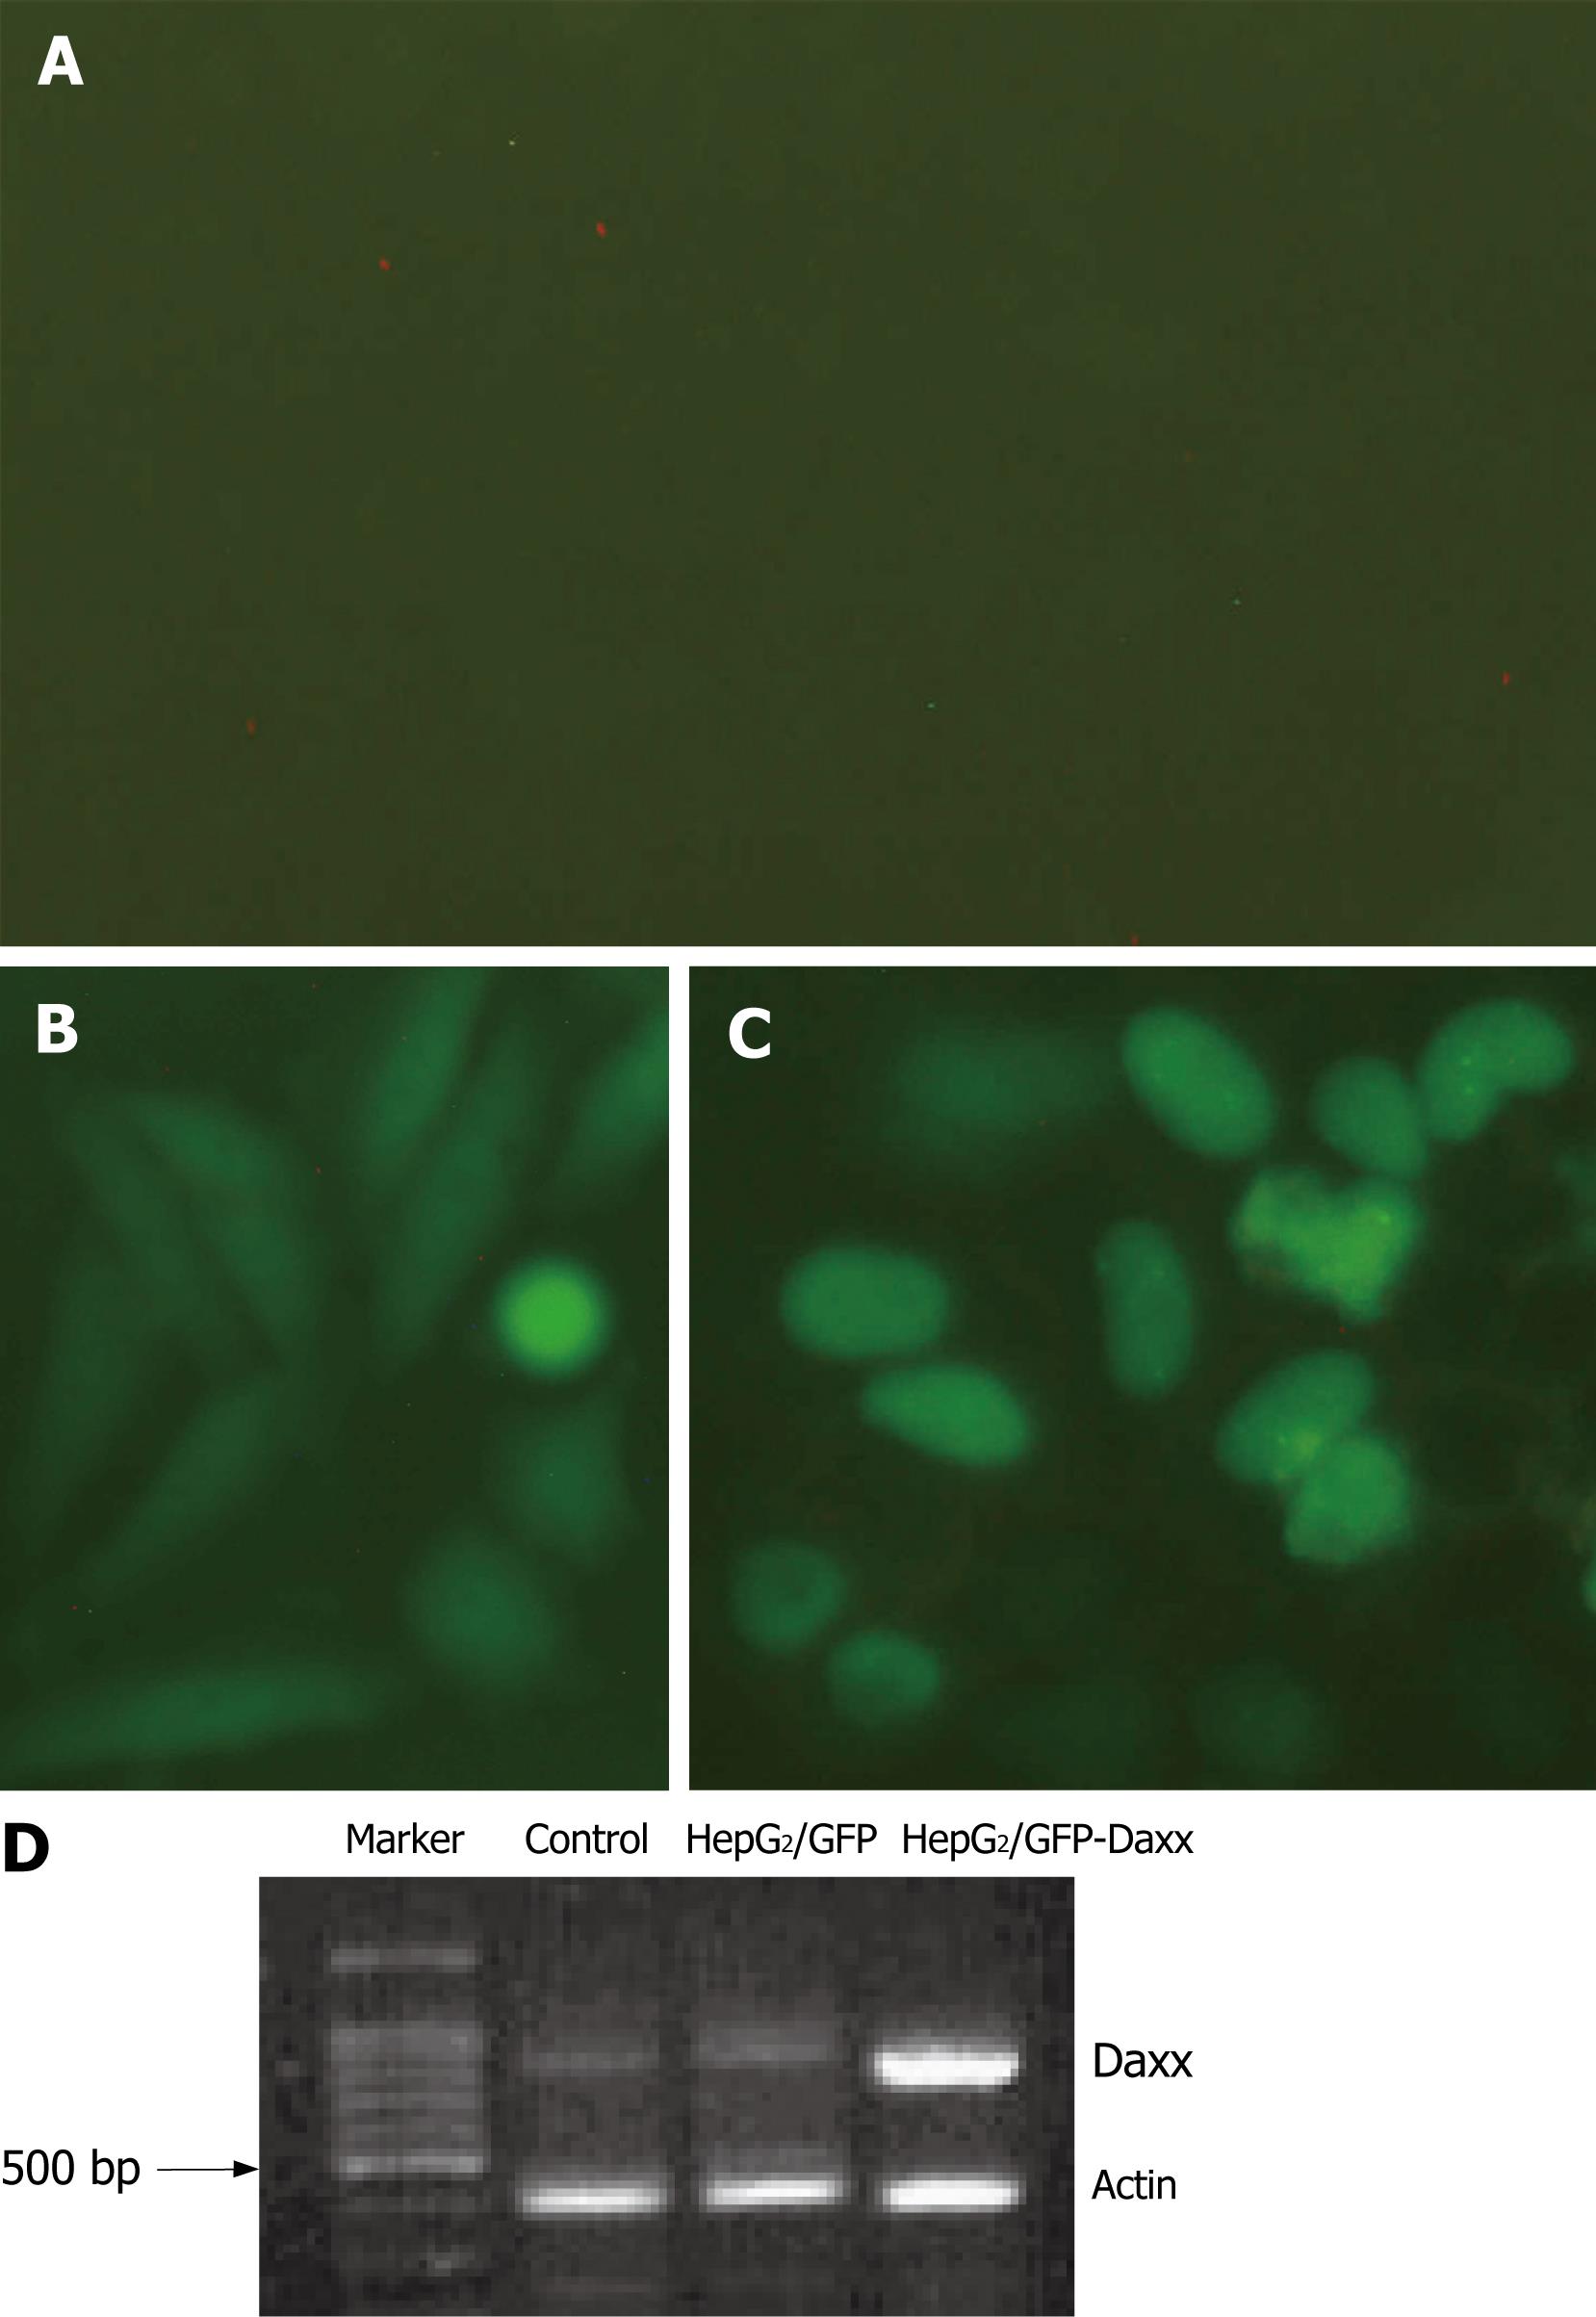
Figure 2 Daxx expression in HepG2 hepatocytes.
Cultured HepG2 cells were untransfected (control, A) or transfected with pEGFP-C1-Daxx or pEGFP-C1 vectors (B, C). Images show the location and expression of Daxx in HepG2 cells, which were taken at 400 × magnitude. (D) RT-PCR of Daxx mRNA expression.
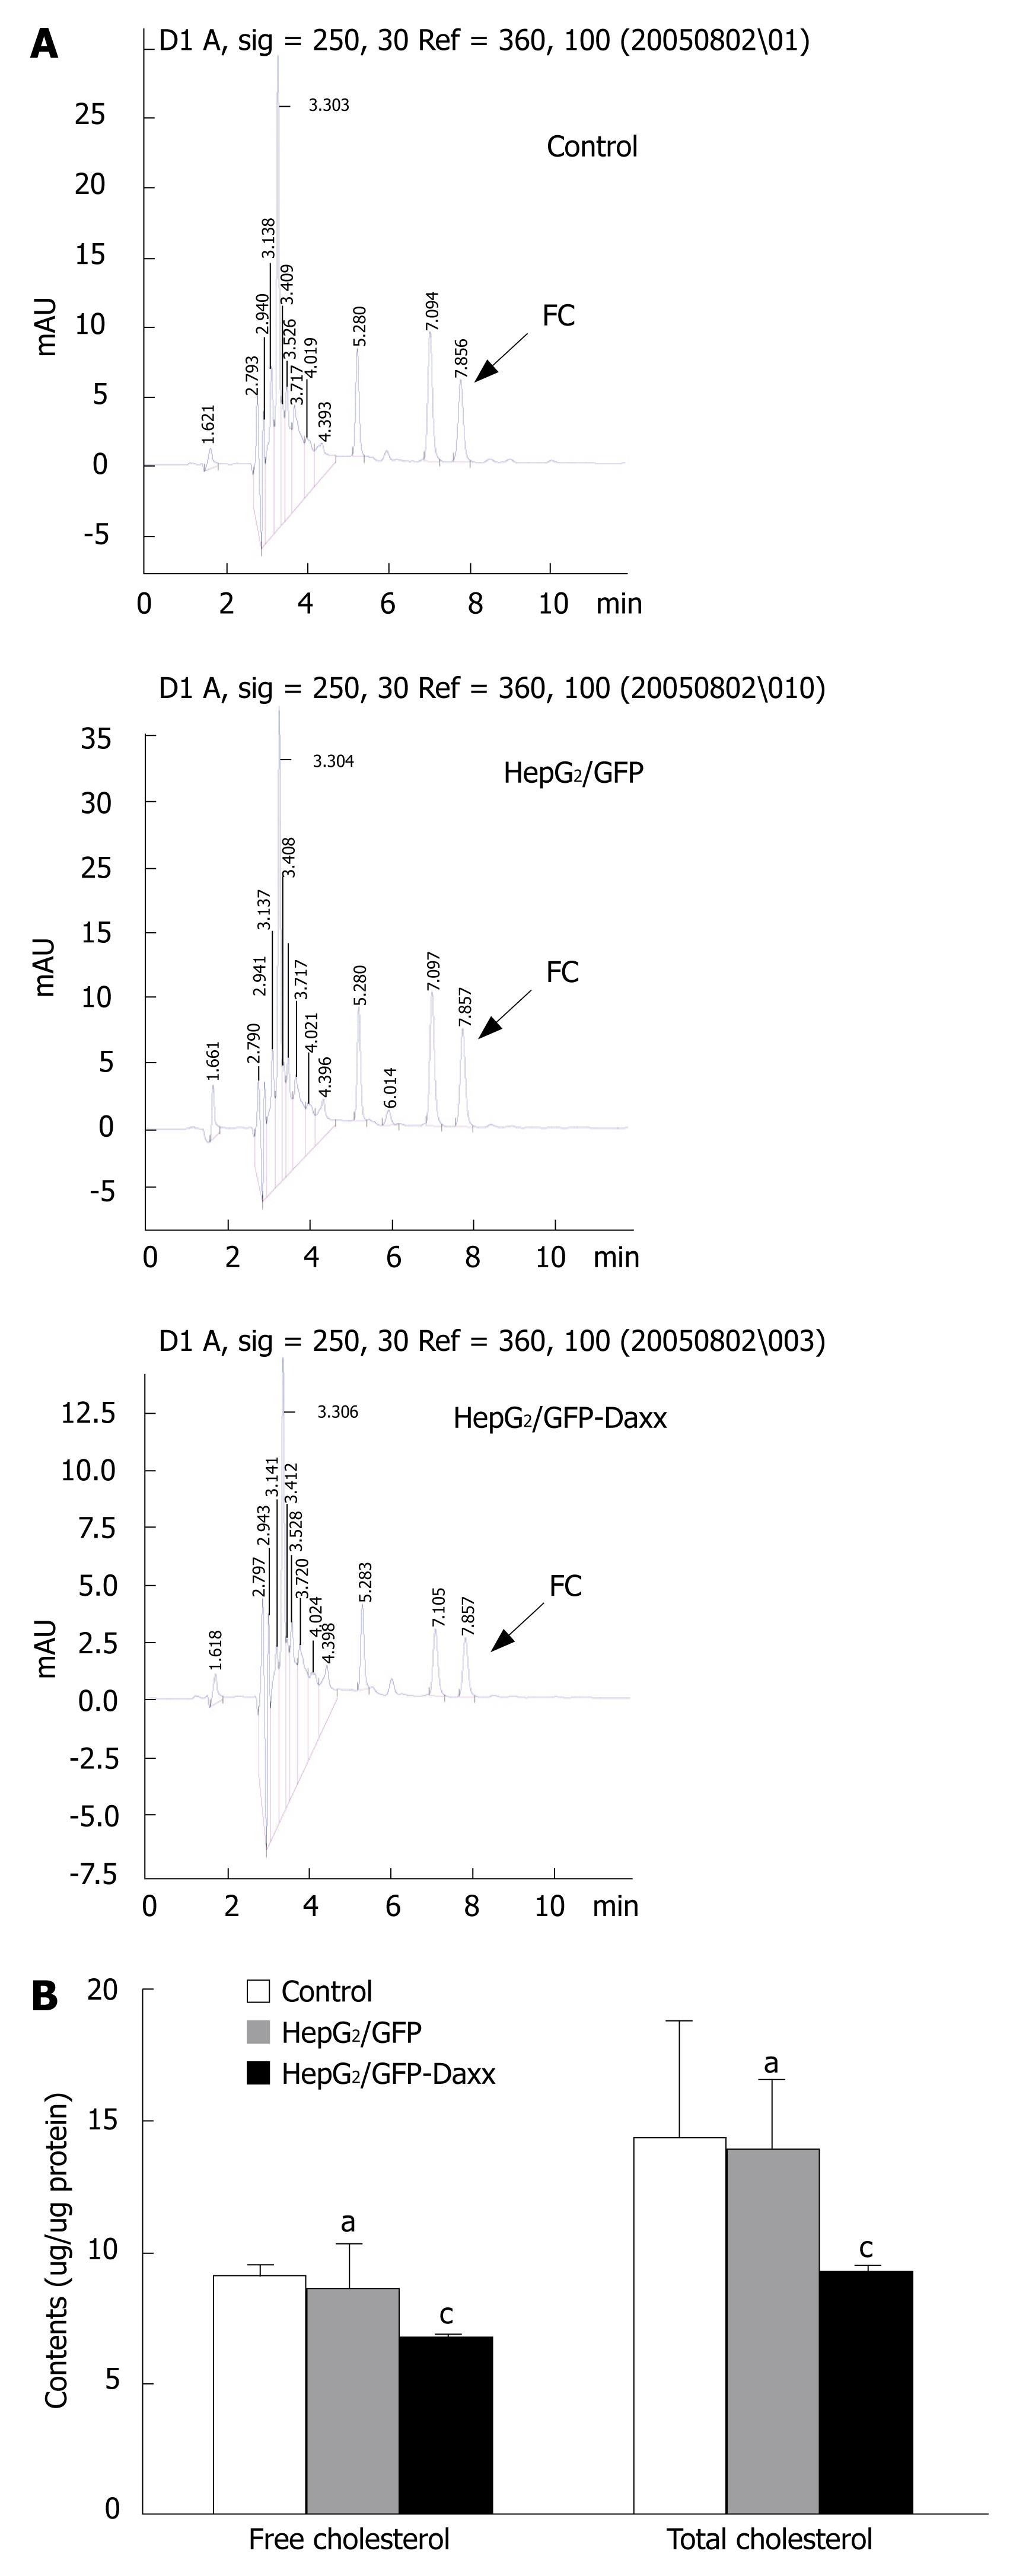
Figure 3 Effect of Daxx overexpression on cholesterol accumulation in HepG2 hepatocytes.
A: Representative change of intracellular cholesterol levels in HepG2 cells, as determined by HPLC; B: The contents of free and total cholesterol in HepG2 cells. FC: Free cholesterol. aP > 0.05 vs control; cP < 0.05 vs control or HepG2/GFP cells.
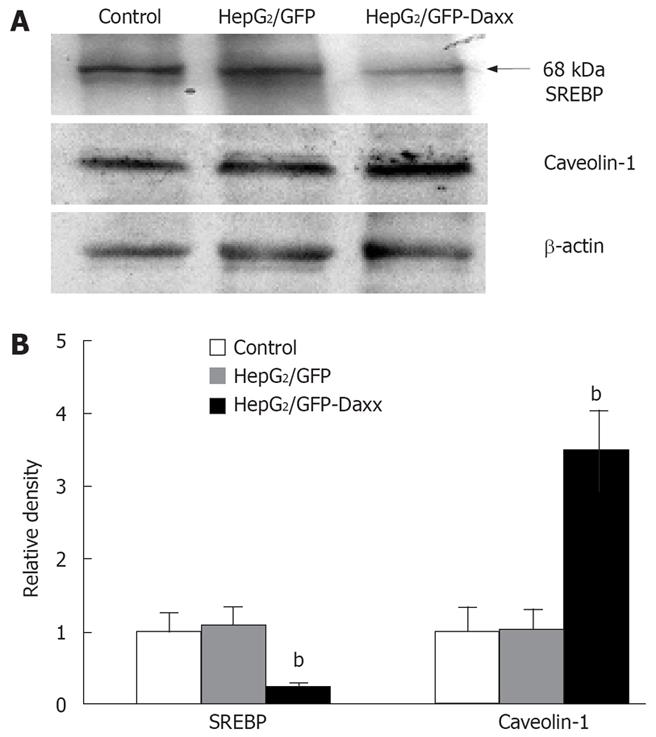
Figure 4 Effect of Daxx on the expression of SREBP and caveolin-1 proteins in HepG2 hepatocytes.
A: Representative western blot data showing the effects of Daxx on SREBP and caveolin-1 proteins in HepG2 cells; B: Quantitative data of the Daxx effect on SREBP and caveolin-1 expression. Data are the mean ± SE of three independent experiments. bP < 0.01 vs control or HepG2/GFP cells.
- Citation: Tuo QH, Liang L, Zhu BY, Cao X, Liao DF. Effect of Daxx on cholesterol accumulation in hepatic cells. World J Gastroenterol 2008; 14(3): 435-440
- URL: https://www.wjgnet.com/1007-9327/full/v14/i3/435.htm
- DOI: https://dx.doi.org/10.3748/wjg.14.435


