Copyright
©2008 The WJG Press and Baishideng.
World J Gastroenterol. Jul 7, 2008; 14(25): 4028-4039
Published online Jul 7, 2008. doi: 10.3748/wjg.14.4028
Published online Jul 7, 2008. doi: 10.3748/wjg.14.4028
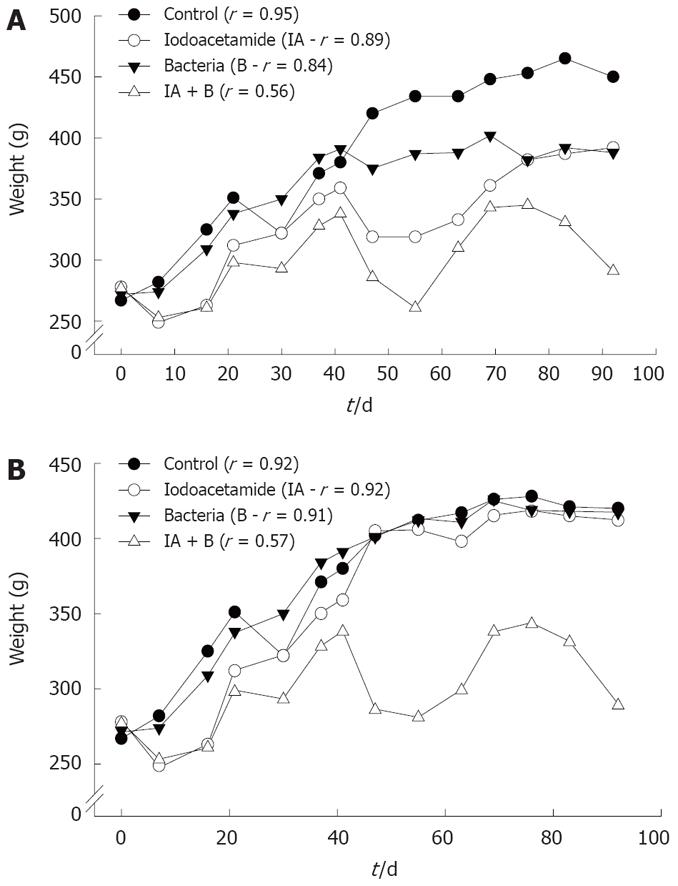
Figure 1 Changes in the average rats' weight in various experimental groups, and in the continued and discontinued treatment subgroups.
A: Continued injection subgroups; B: Discontinued injection subgroups. r: represents the correlation coefficient of weight change vs time. All readings were statistically significant (P < 0.005). Note the slow oscillating rate of increase in the two (IA + B) subgroups and in the continued injection IA subgroup.
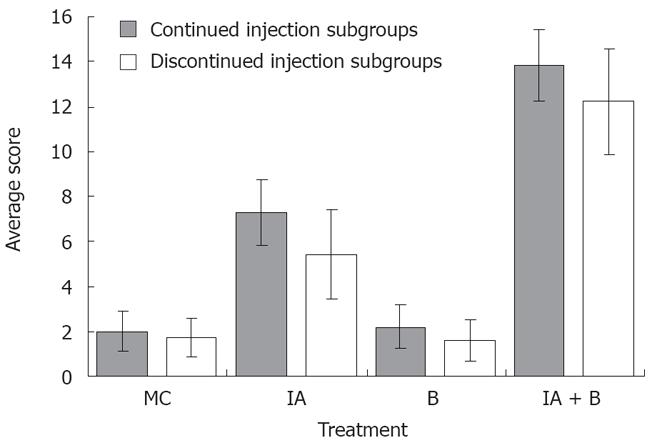
Figure 2 Macroscopic assessment.
The overall average colonic score at different time intervals of the various experimental groups both in the continued and discontinued injection subgroups (Readings represent the average of the scores on days 3, 7, 14, 28, 42, 56, and 70 in each group).
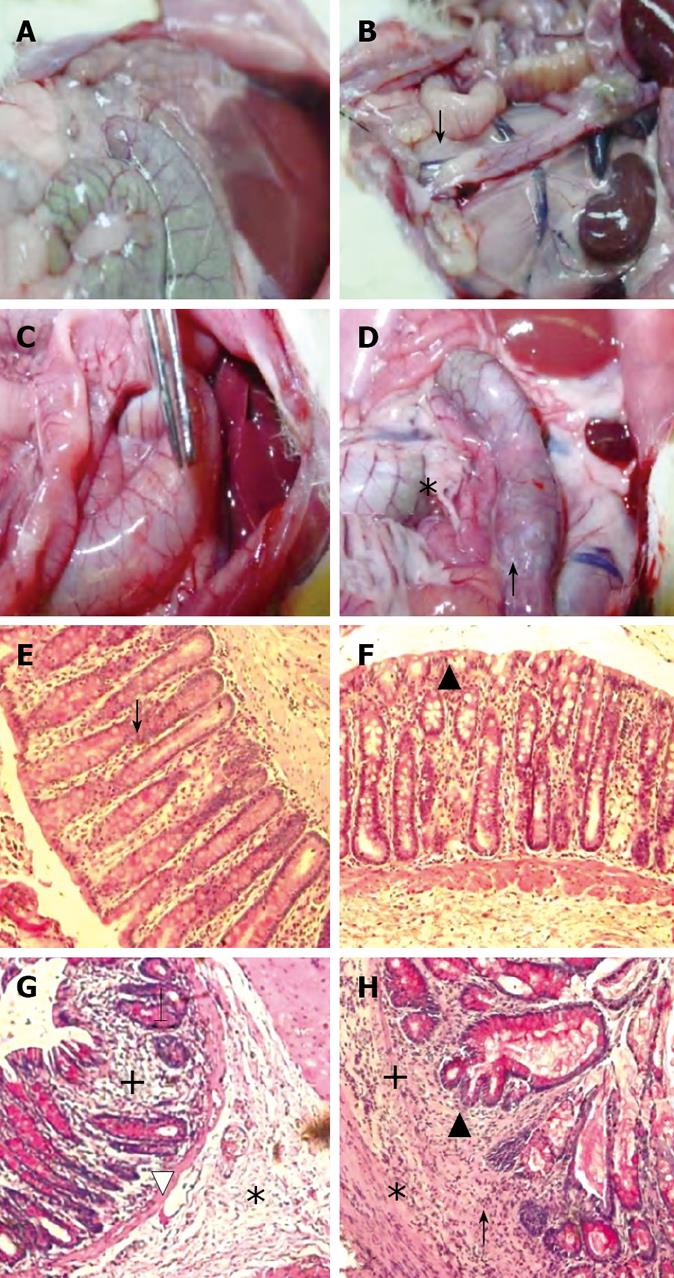
Figure 3 Representative photographs of macroscopic (upper row) and microscopic (lower row, HE stain x 200 ) findings on day 70 in treatment groups MC, B, IA and IA + B.
A and B: Normal colon, note the whitish area at the site of multiple inoculation of the EPEC in colons of B-treated animals (↓); C: Note the vasodilatation and enlargement of the colon (forceps) in the IA treated rats; D: Note adhesions (*), hyperemia and vasodilatation of an enlarged colon and a darkened site reflecting blackish mucosa (↑) in the IA + B treated animals; E and F: Normal microscopic appearance of the colon in the MC and B-treated groups. Well aligned parallel crypts (↓) continuous epithelial lining (▲) normal muscularis mucosa and normal lamina propria infiltration by cells; G: Shows cryptitis (↓), infiltration of inflammatory cells (+) and edema (*) in the submucosal with thinning of the muscularis mucosa and vasodilatation (∆); H: Crypt deformities and bifurcation (▲), cryptitis (↑), extensive inflammatory cells infiltrate (+) and edema (*).
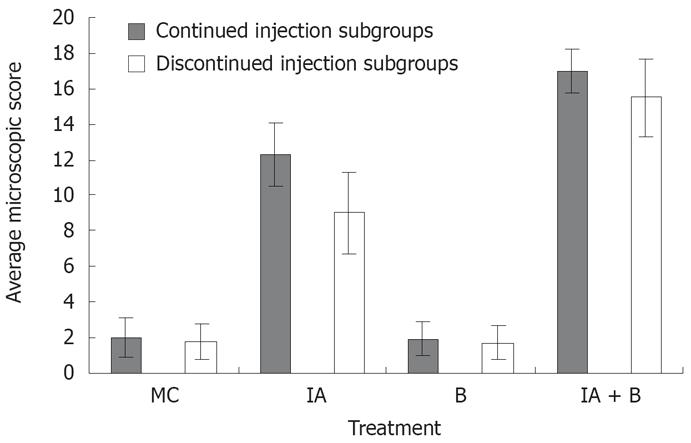
Figure 4 Microscopic assessment.
The overall average histological score in the different experimental groups both in the continued and discontinued injection subgroups (Readings represent average of day 3, 7, 14, 28, 42, 56, and 70 in each group).
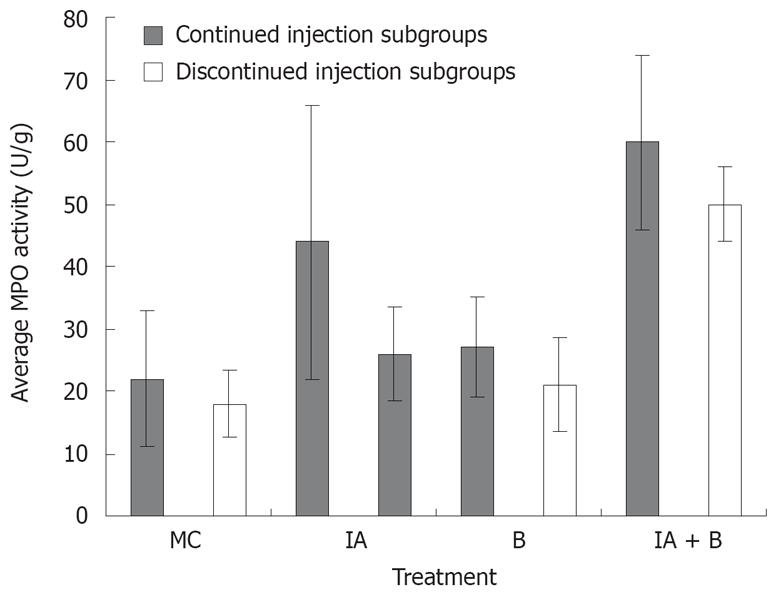
Figure 5 Average MPO activity in the various experimental groups in the continued and discontinued injection subgroups (readings represent average of day 3, 7, 14, 28, 42, 56, and 70 in each group).
The increase in the MPO activity in the IA+B subgroup was significantly greater (P < 0.005) compared to all the other subgroups. The IA continued injection subgroup also showed a significant increase (P < 0.005) compared to the control group.
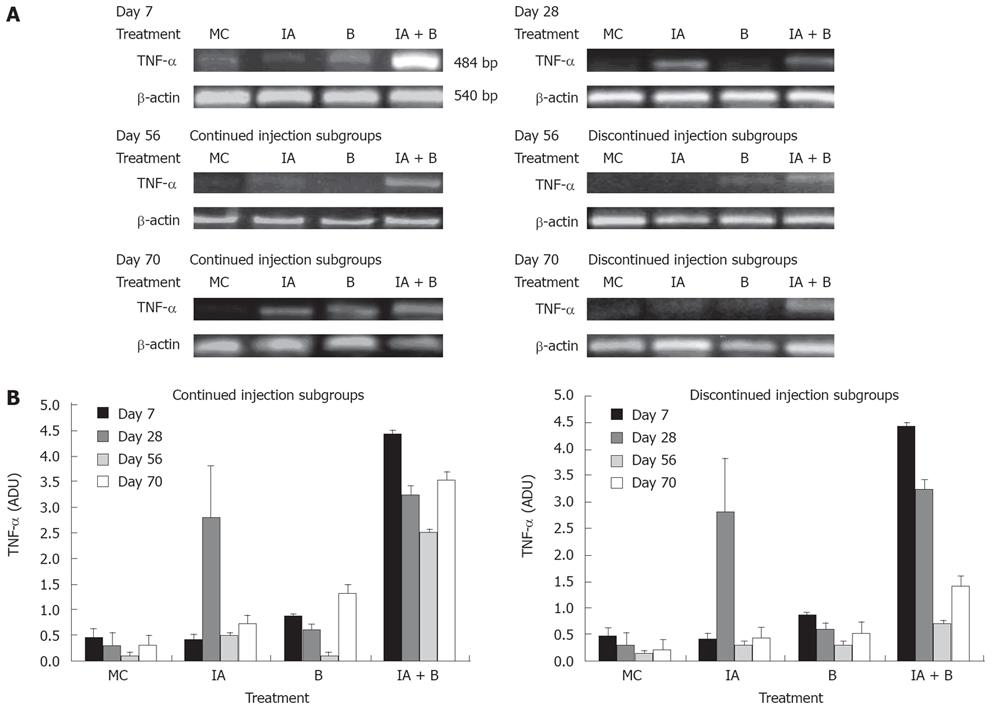
Figure 6 A: Representative photographs from three independent experiments of TNF-α mRNA expression in the descending colon in the various experimental groups at selected time points: day 7, day 28, day 56 continued injection subgroup, day 56 discontinued injection subgroup, day 70 continued injection subgroup, and day 70 discontinued injection subgroup.
Band intensity was adjusted for the corresponding β-actin, and values were expressed as arbitrary density units (ADU); B: Expression of TNF-α mRNA in the descending colon in the various experimental groups both in the continued and discontinued injection subgroups, at all time points. Note the presence of significant difference in expression between the IA + B compared to the other groups (P < 0.005).
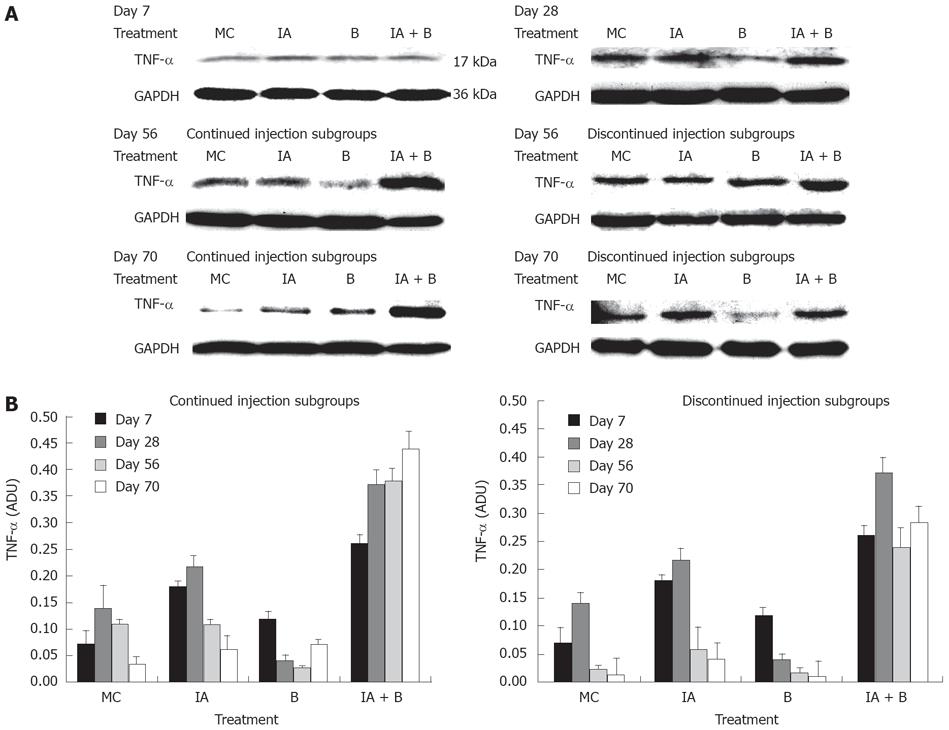
Figure 7 A: Representative photographs from three independent experiments of TNF-α protein expression in the descending colon in the various experimental groups at selected time points: day 7, day 28, day 56 continued injection subgroup, day 56 discontinued injection subgroup, day 70 continued injection subgroup and day 70 discontinued injection subgroup.
Band intensity was adjusted for the corresponding GAPDH, and values were expressed as arbitrary density units (ADU); B: TNF-α protein expression in the descending colon in the various experimental groups both in the continued and discontinued injection subgroups, in response to treatment at all time points. Note the significant difference in expression between the IA + B and the other groups (P < 0.005).
- Citation: Hussein IAH, Tohme R, Barada K, Mostafa MH, Freund JN, Jurjus RA, Karam W, Jurjus A. Inflammatory bowel disease in rats: Bacterial and chemical interaction. World J Gastroenterol 2008; 14(25): 4028-4039
- URL: https://www.wjgnet.com/1007-9327/full/v14/i25/4028.htm
- DOI: https://dx.doi.org/10.3748/wjg.14.4028


