Copyright
©2008 The WJG Press and Baishideng.
World J Gastroenterol. Jun 28, 2008; 14(24): 3849-3854
Published online Jun 28, 2008. doi: 10.3748/wjg.14.3849
Published online Jun 28, 2008. doi: 10.3748/wjg.14.3849
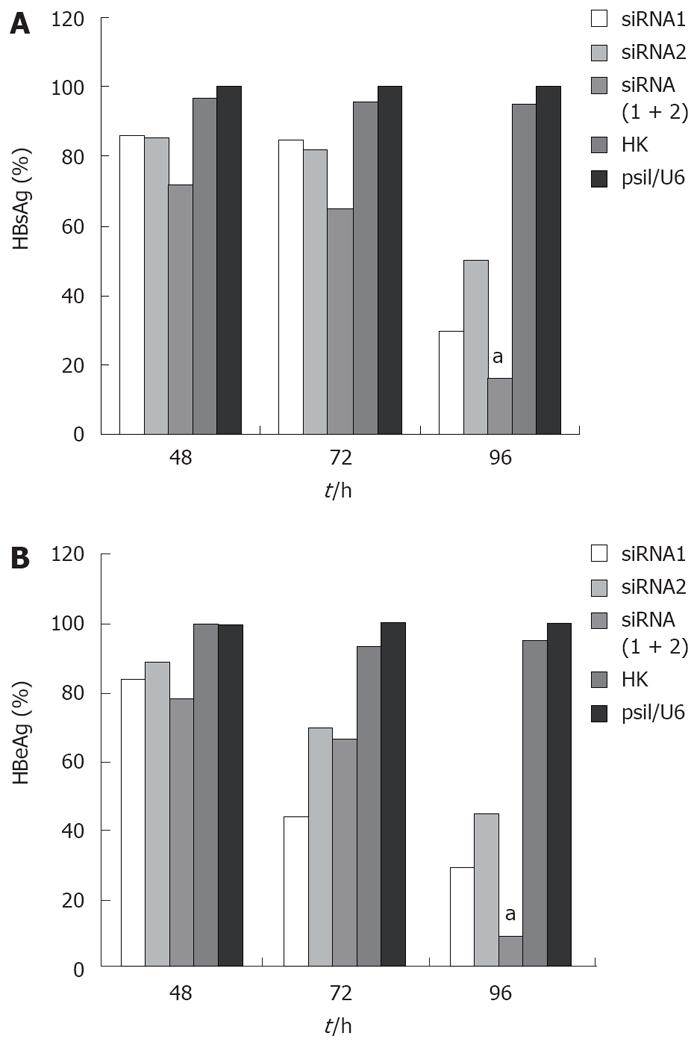
Figure 1 Relative expression of HBsAg (A) and HBeAg (B).
aP < 0.05 vs siRNA1 or siRNA2.
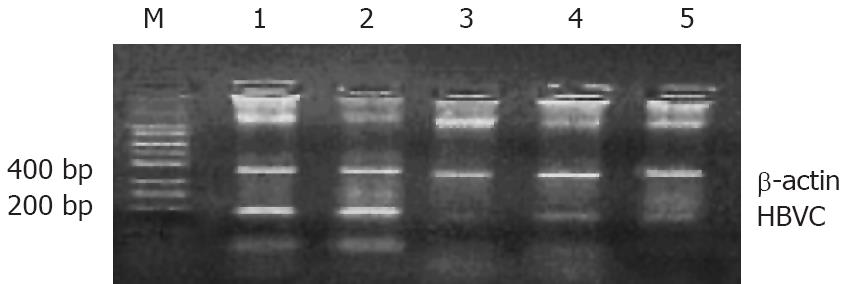
Figure 2 Reduction in HBV mRNA level after treatment with siRNA.
M: marker, lane 1: HK, lane 2: psil/U6, lane 3: siRNAs 1 and 2, lane 4: siRNA2, lane 5: siRNA1.
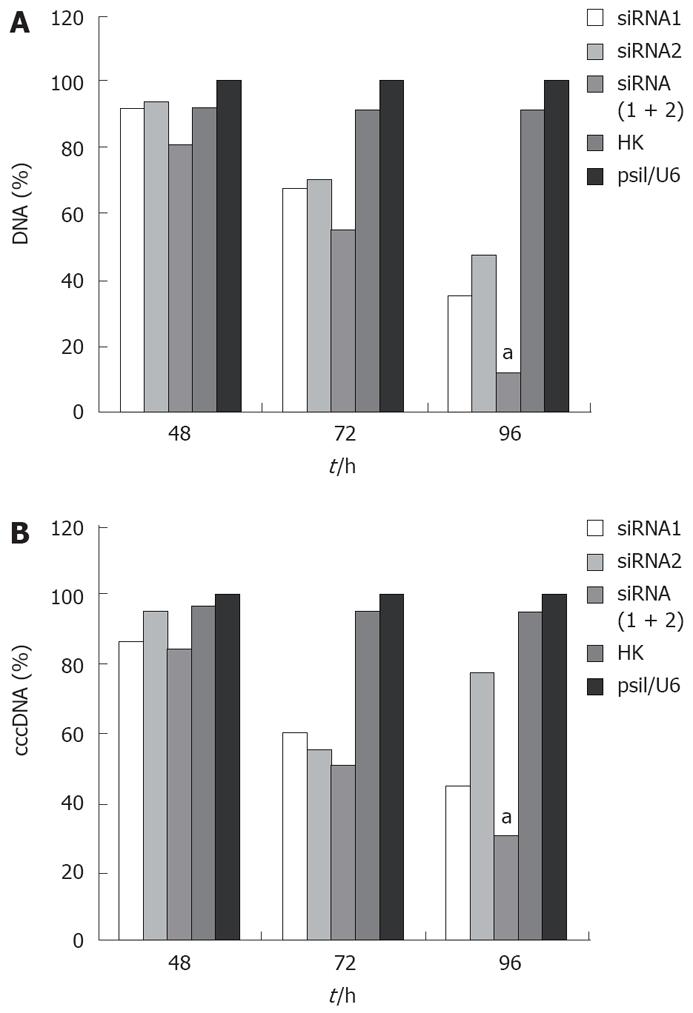
Figure 3 Inhibition of HBV DNA (A) and cccDNA (B) amplification after treatment with siRNA.
aP < 0.05 vs siRNA1 or siRNA2.
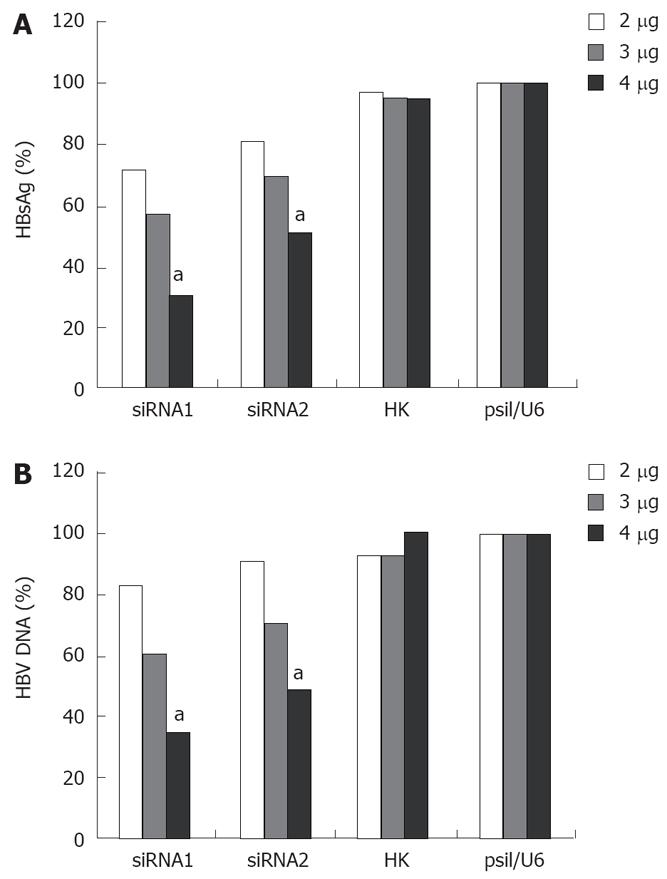
Figure 4 Dose-dependent inhibitory effects of siRNA on HBV antigen HBsAg expression (A) and HBV replication (B).
aP < 0.05 vs 2 &mgr;g or 3 &mgr;g.
- Citation: Xin XM, Li GQ, Jin YY, Zhuang M, Li D. Combination of small interfering RNAs mediates greater suppression on hepatitis B virus cccDNA in HepG2.2.15 cells. World J Gastroenterol 2008; 14(24): 3849-3854
- URL: https://www.wjgnet.com/1007-9327/full/v14/i24/3849.htm
- DOI: https://dx.doi.org/10.3748/wjg.14.3849


