Copyright
©2008 The WJG Press and Baishideng.
World J Gastroenterol. Jun 28, 2008; 14(24): 3819-3828
Published online Jun 28, 2008. doi: 10.3748/wjg.14.3819
Published online Jun 28, 2008. doi: 10.3748/wjg.14.3819
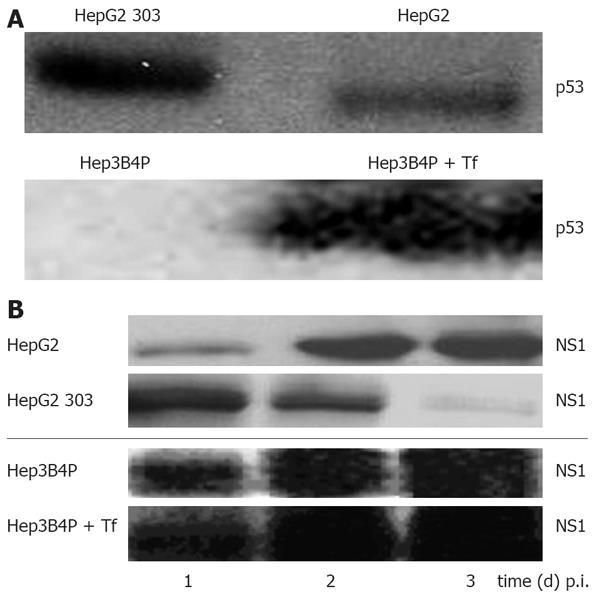
Figure 1 A: Characterisation of the p53 status and analysis of parvoviral proteins in different human tumor cells by Western blot.
Cells were cultured for 2 d and lysed with RIPA buffer, and 50 µg of total protein was subjected to SDS-PAGE. For p53 protein detection, blots were incubated with the monoclonal DO-7 antibody; B: Production of parvoviral proteins in H-1 PV-infected p53 different tumor cells. Hep3B4P and HepG2 cells were H-1 PV-infected (MOI = 20 pfu/cell) and grown for 1 to 3 d. After lysis with RIPA buffer, 50 &mgr;g of total proteins were equally diluted and separated on SDS-PAGE. For parvoviral protein detection, blots were incubated with the NS1-specific antibody[37].
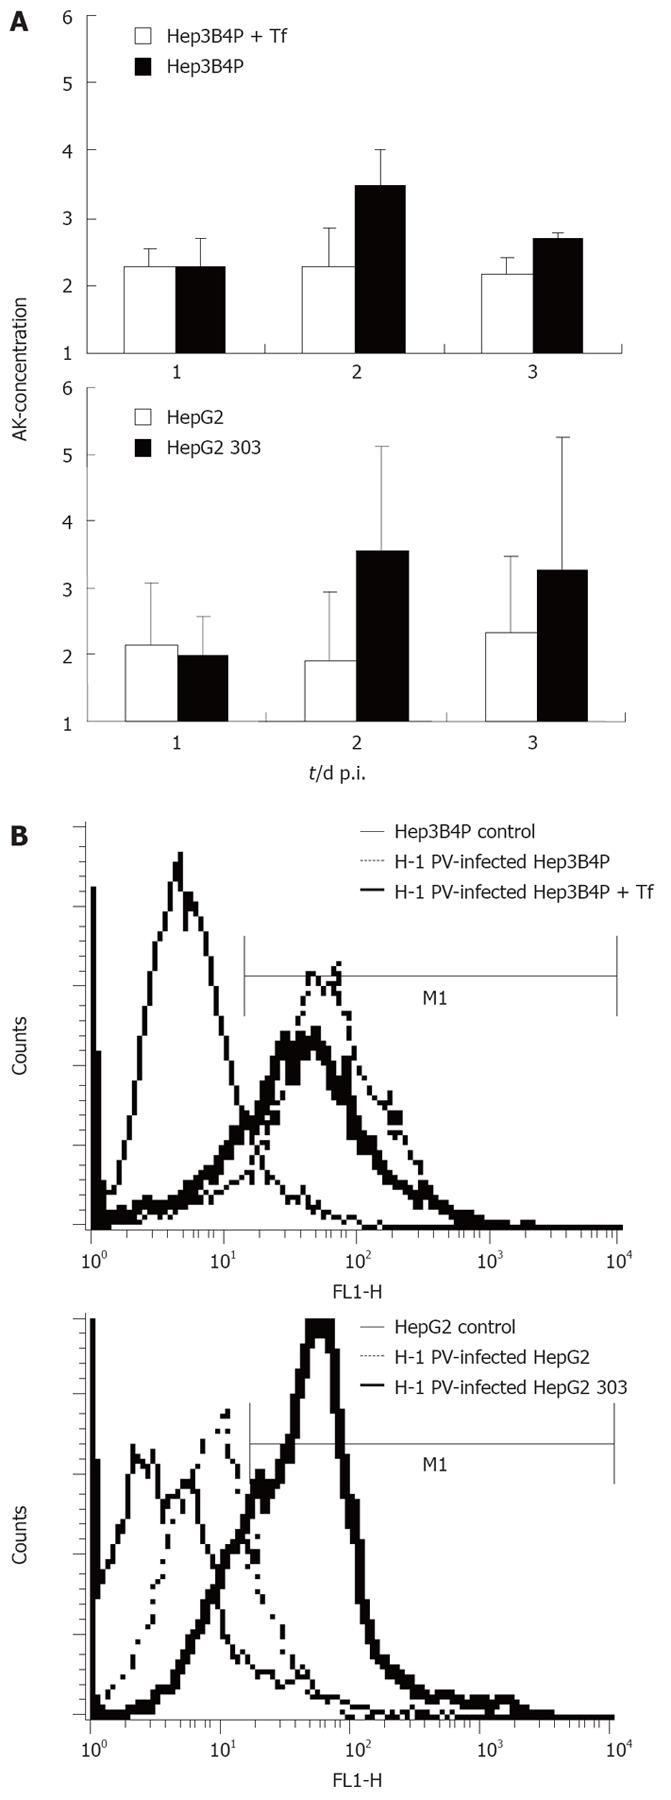
Figure 2 A: Cytotoxicity and induction of apoptosis in H-1 PV-infected p53 different tumor cell line pairs.
The early damage of tumor cells upon H-1 PV infection was measured with a standardized toxicity test via supernatant adenylate kinase (AK) concentration; B: Induction of apoptosis in H-1 PV-infected tumor cells is shown in histograms for annexin V (FL1-H) of Hep3B4P and HepG2 cells. Data are given as mean values of triplicates.
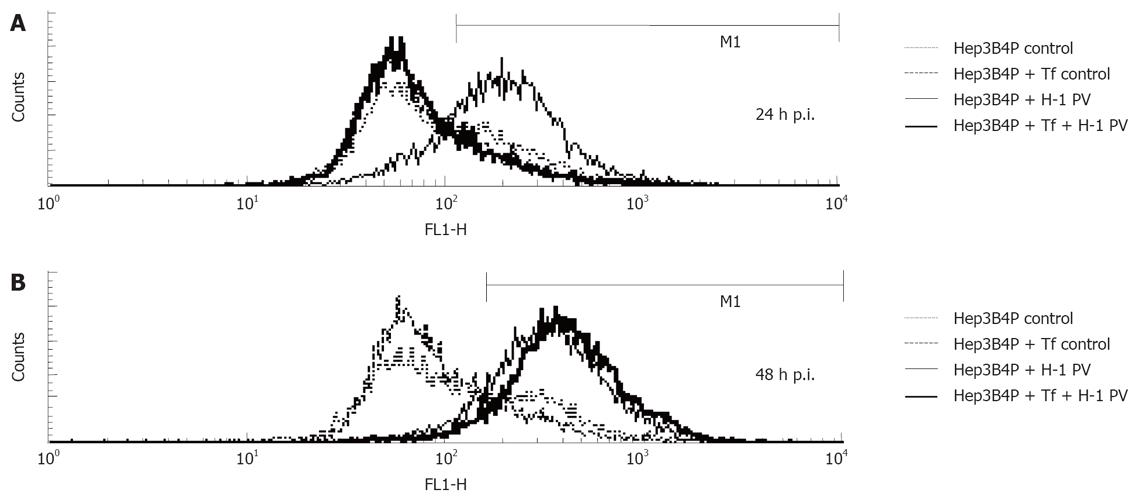
Figure 3 Analysis of mitochondrial membrane potential.
Kinetics of reduction of the mitochondrial membrane potential. Hepatoma cells were left untreated (control) or infected (H-1 PV) for the indicated periods of time and analyzed by flow cytometry using the fluorochrome JC-1. The percentage of cells with decreased mitochondrial membrane potential is shown. After one (A) and two (B) days incubation, the percentage of cells with decreased mitochondrial membrane potential were determined by flow cytometry.
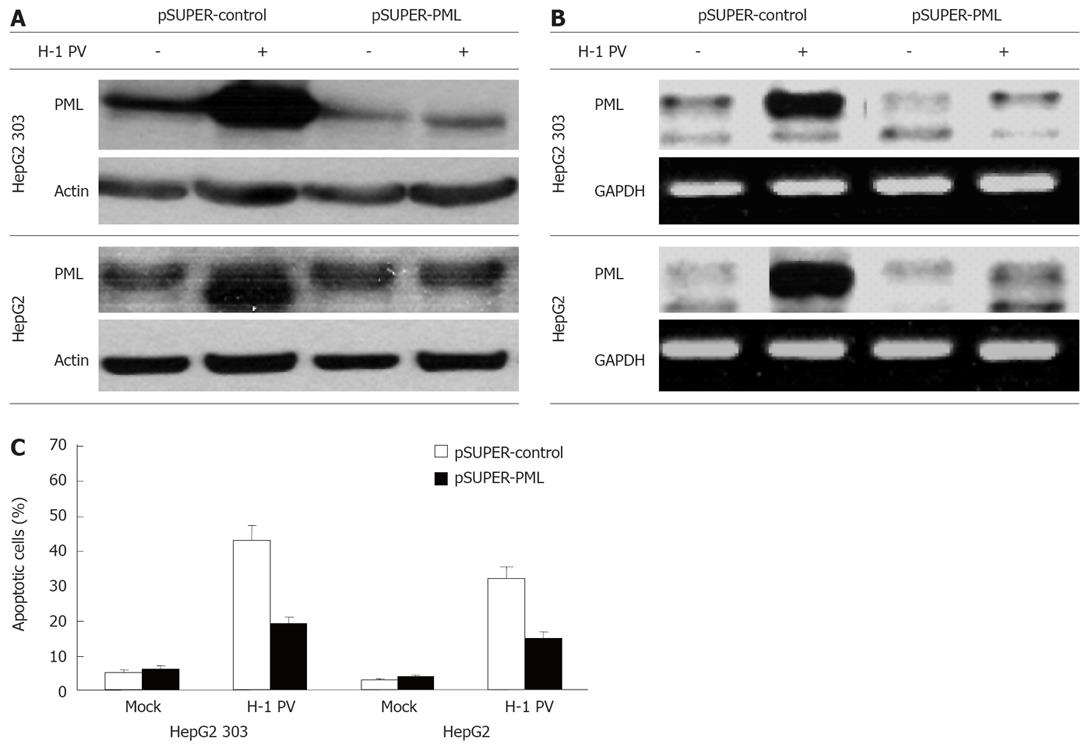
Figure 4 H-1 PV-induced apoptosis is mediated by PML.
HepG2 (p53+) and HepG2 303 (p53-) cells were transfected with pSUPER or pSUPER-PML as indicated, and infected with H-1 PV for 48 h. Cells were harvested and subjected to Western blot (A) or PCR analysis (B). Hepatoma cells were treated as described, harvested, and subjected to cytotoxicity assay. Apoptosis was determined as described in Material and Methods (C).
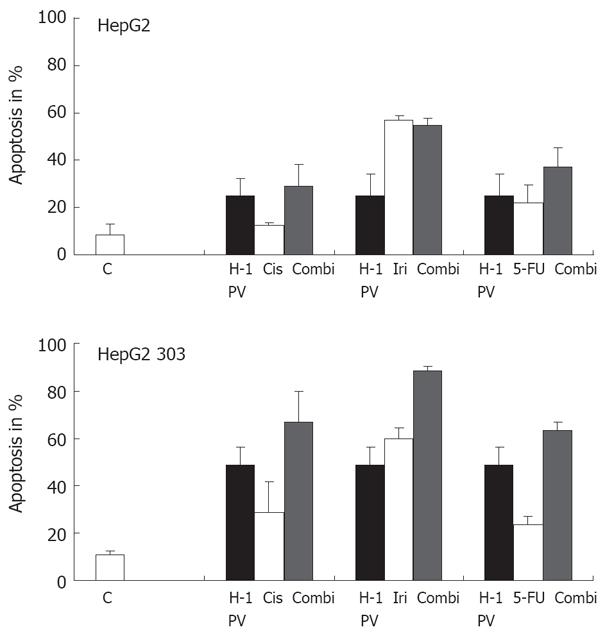
Figure 5 Treatment of p53 different tumor cells with chemotherapeutic agents.
The p53 different HepG2 cells were treated with various chemotherapeutic agents alone or combined with H-1 PV infection (MOI = 20 pfu/cell). H-1 PV- or mock-infected cells were seeded into 6-well plates, and 1 h after infection cultures were treated with chemotherapeutic agents as indicated. Apoptosis was measured on day 3 by FACScan analysis. Data given represent mean values of triplicates.
- Citation: Sieben M, Herzer K, Zeidler M, Heinrichs V, Leuchs B, Schuler M, Cornelis JJ, Galle PR, Rommelaere J, Moehler M. Killing of p53-deficient hepatoma cells by parvovirus H-1 and chemotherapeutics requires promyelocytic leukemia protein. World J Gastroenterol 2008; 14(24): 3819-3828
- URL: https://www.wjgnet.com/1007-9327/full/v14/i24/3819.htm
- DOI: https://dx.doi.org/10.3748/wjg.14.3819


