Copyright
©2008 The WJG Press and Baishideng.
World J Gastroenterol. Jun 28, 2008; 14(24): 3819-3828
Published online Jun 28, 2008. doi: 10.3748/wjg.14.3819
Published online Jun 28, 2008. doi: 10.3748/wjg.14.3819
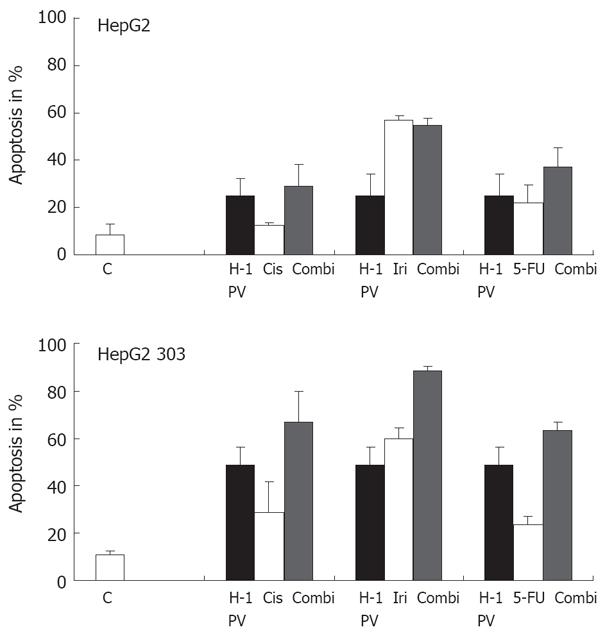
Figure 5 Treatment of p53 different tumor cells with chemotherapeutic agents.
The p53 different HepG2 cells were treated with various chemotherapeutic agents alone or combined with H-1 PV infection (MOI = 20 pfu/cell). H-1 PV- or mock-infected cells were seeded into 6-well plates, and 1 h after infection cultures were treated with chemotherapeutic agents as indicated. Apoptosis was measured on day 3 by FACScan analysis. Data given represent mean values of triplicates.
- Citation: Sieben M, Herzer K, Zeidler M, Heinrichs V, Leuchs B, Schuler M, Cornelis JJ, Galle PR, Rommelaere J, Moehler M. Killing of p53-deficient hepatoma cells by parvovirus H-1 and chemotherapeutics requires promyelocytic leukemia protein. World J Gastroenterol 2008; 14(24): 3819-3828
- URL: https://www.wjgnet.com/1007-9327/full/v14/i24/3819.htm
- DOI: https://dx.doi.org/10.3748/wjg.14.3819


