Copyright
©2008 The WJG Press and Baishideng.
World J Gastroenterol. Jun 21, 2008; 14(23): 3754-3758
Published online Jun 21, 2008. doi: 10.3748/wjg.14.3754
Published online Jun 21, 2008. doi: 10.3748/wjg.14.3754
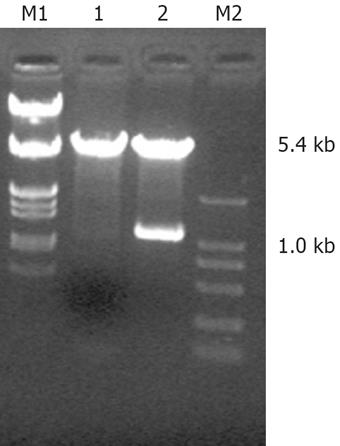
Figure 1 Identification of pcDNA3.
1 (+)/FHIT by enzyme-cutting assay. M1: Marker λ/DNA/EcoRI+HindIII; M2: Marker DL2000, lane 1: pcDNA3.1 (+)/FHIT, lane 2: pcDNA3.1 (+)/FHIT post enzyme cutting.
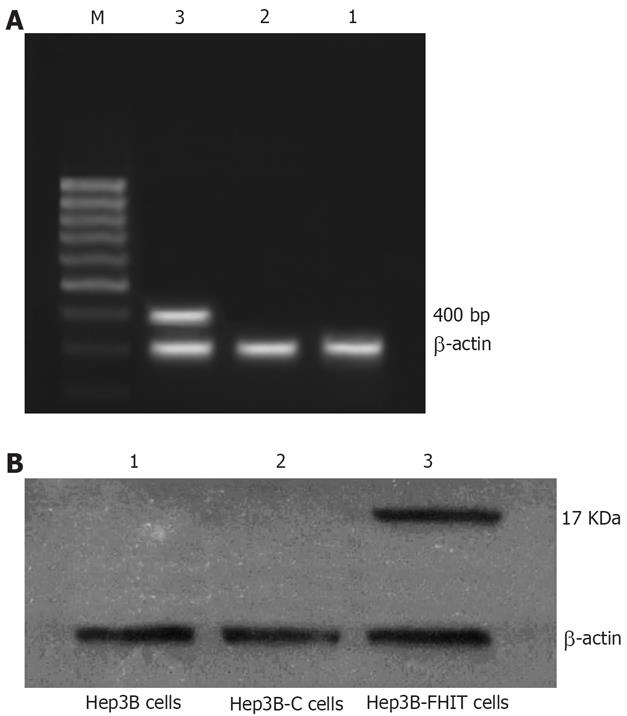
Figure 2 Expression of FHIT mRNA and protein in Hep3B-FHIT, Hep3B-C and Hep3B cells.
A: FHIT mRNA; B: FHIT protein. M: 1000 bp marker; Lane 1: Hep3B cells; lane 2: Hep3B-C cells; lane 3: Hep3B-FHIT cells.
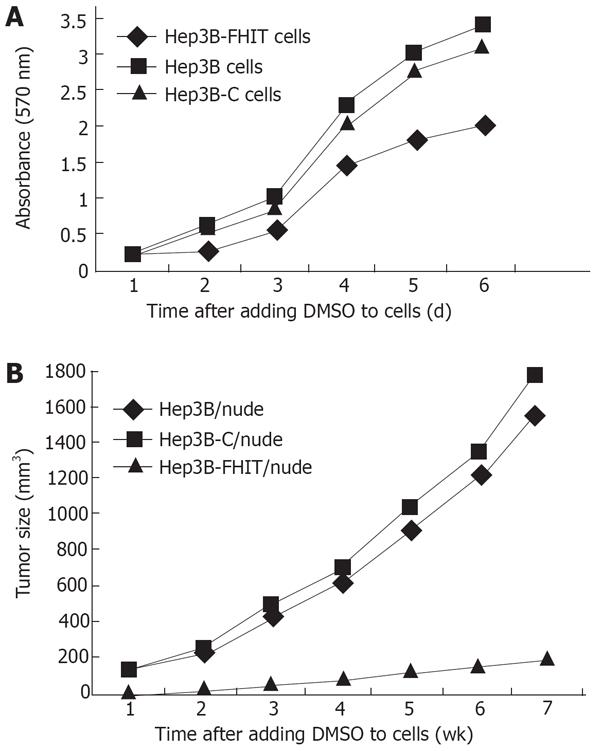
Figure 3 Growth curves.
A: Growth curves of human hepatocellular carcinoma cells. Luminous absorbance of Hep3B-FHIT, Hep3B-C and Hep3B cells was measured by ELISA (wavelength of 570 nm) after DMSO was added. The measurement was done once a day for 6 d; B: Growth curves of tumors after implantation of Hep3B, Hep3B-C or Hep3B-FHIT cells in nude mice. The mice were injected sc with 1 × 10⁷ (0.15 mL/mouse) Hep3B, Hep3B-C or Hep3B-FHIT cells. After implantation, tumor growth was detected weekly.
- Citation: Xu RH, Zheng LY, He DL, Tong J, Zheng LP, Zheng WP, Meng J, Xia LP, Wang CJ, Yi JL. Effect of fragile histidine triad gene transduction on proliferation and apoptosis of human hepatocellular carcinoma cells. World J Gastroenterol 2008; 14(23): 3754-3758
- URL: https://www.wjgnet.com/1007-9327/full/v14/i23/3754.htm
- DOI: https://dx.doi.org/10.3748/wjg.14.3754


