Copyright
©2008 The WJG Press and Baishideng.
World J Gastroenterol. Jun 14, 2008; 14(22): 3476-3483
Published online Jun 14, 2008. doi: 10.3748/wjg.14.3476
Published online Jun 14, 2008. doi: 10.3748/wjg.14.3476
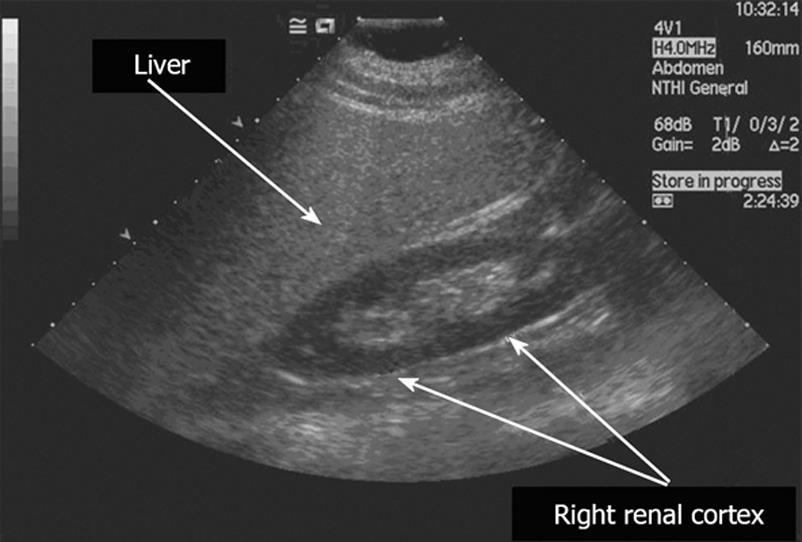
Figure 1 Ultrasound findings in hepatic steatosis.
The steatotic liver is hyper-echoic, compared to the cortex of the right kidney. In addition, there is posterior attenuation of the ultrasound beam and reduced definition of the portal vein walls.
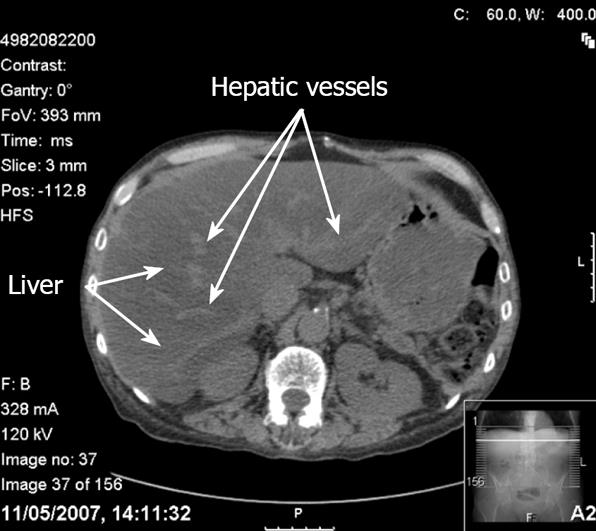
Figure 2 CT findings in hepatic steatosis.
In this contrast unenhanced scan, the liver appears darker than the spleen and the hepatic vessels appear bright. The increased brightness of the vessels relative to the liver parenchyma may erroneously suggest the use of contrast.
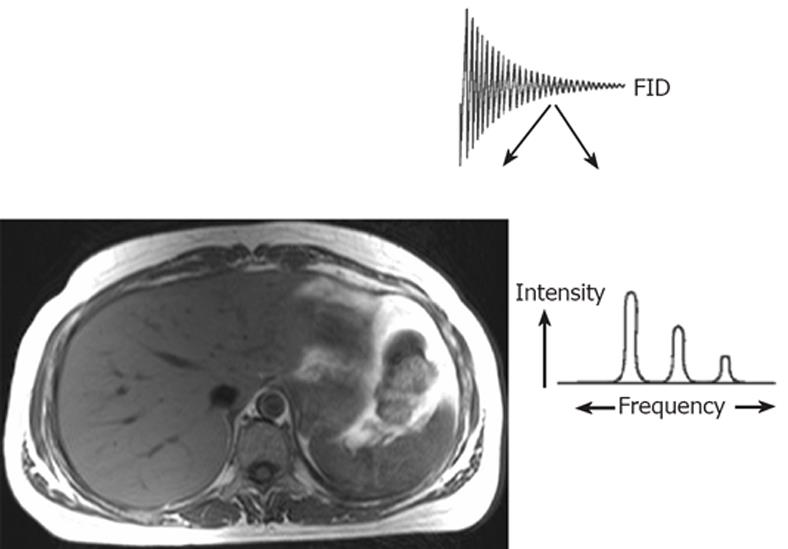
Figure 3 Principles of magnetic resonance.
The magnetic resonance (MR) signal or free induction decay (FID) may be converted by the mathematical process of Fourier transformation to form anatomical information (MR imaging) or localised biochemical information (MR spectroscopy). Modified from Taylor-Robinson SD Applications of magnetic resonance spectroscopy to chronic liver disease. Clin Med 2001; 1: 54-60 Copyright © 2001 Royal College of Physicians. Adapted by permission.
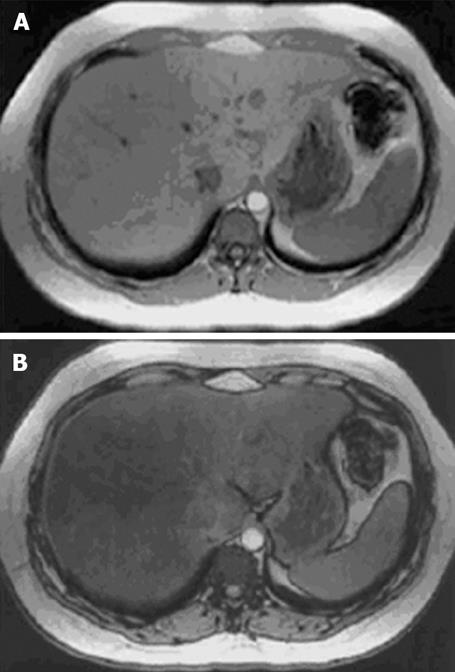
Figure 4 In and opposed phase MR images of a liver illustrating the signal drop-off from an in-phase (A) to an opposed-phase image (B) in a patient with marked steatosis.
Reproduced from Rinella et al. Liver Transplantation 2003; 9: 851-856. Copyright (2003) American Association for the Study of Liver Diseases. Reprinted with permission of Wiley-Liss, Inc., a subsidiary of John Wiley & Sons, Inc.
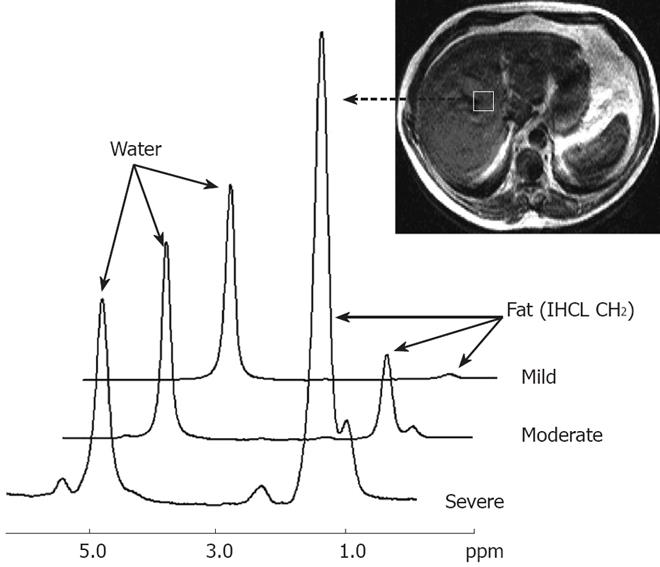
Figure 5 Proton magnetic resonance spectra from three volunteers showing progressive degrees of hepatic fatty infiltration.
Resonances from water and lipid (IHCL CH2) can be clearly seen. For each individual hepatic fatty infiltration was quantified using the equation: -Percentage fat = IHCL CH2 peak area/Water peak area × 100. Shown are spectra from a liver with very mild fatty infiltration (1.0%), a liver with moderate fatty infiltration (10.2%), and a liver with severe fatty infiltration (74.9%). Adapted from Thomas et al. Gut 2005; 54: 122-127, with permission from the BMJ Publishing Group.
- Citation: Mehta SR, Thomas EL, Bell JD, Johnston DG, Taylor-Robinson SD. Non-invasive means of measuring hepatic fat content. World J Gastroenterol 2008; 14(22): 3476-3483
- URL: https://www.wjgnet.com/1007-9327/full/v14/i22/3476.htm
- DOI: https://dx.doi.org/10.3748/wjg.14.3476


