Copyright
©2008 The WJG Press and Baishideng.
World J Gastroenterol. May 14, 2008; 14(18): 2832-2837
Published online May 14, 2008. doi: 10.3748/wjg.14.2832
Published online May 14, 2008. doi: 10.3748/wjg.14.2832
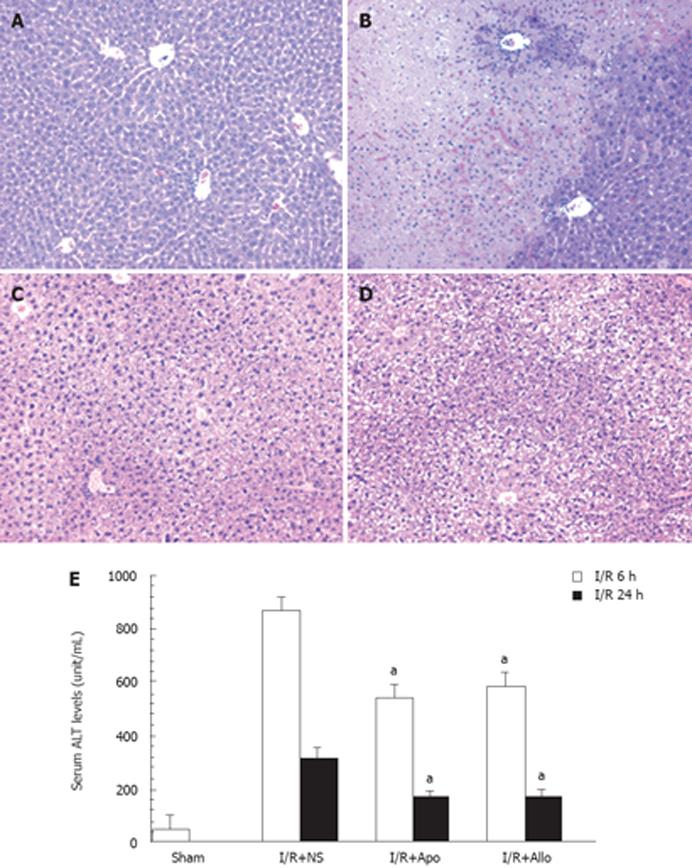
Figure 1 Attenuation of I/R-induced liver injury by apocynin and allopurinol in mice.
A-D: Representative micrographs of liver histology (× 100). A: Normal liver; B: I/R-induced liver injury 6 h after starting reperfusion; C and D: Attenuation of liver injury with apocynin (APO) (C) or Allo (allopurinol) (D); E: Serum ALT levels in mice receiving apocynin or allopurinol and subsequently the hepatic I/R procedure. Serum ALT levels were determined 6 h and 24 h after starting reperfusion (n = 6 each group), and expressed as mean ± SEM. aP < 0.01 vs I/R procedure plus normal saline (N.S.) at 6 h or 24 h.
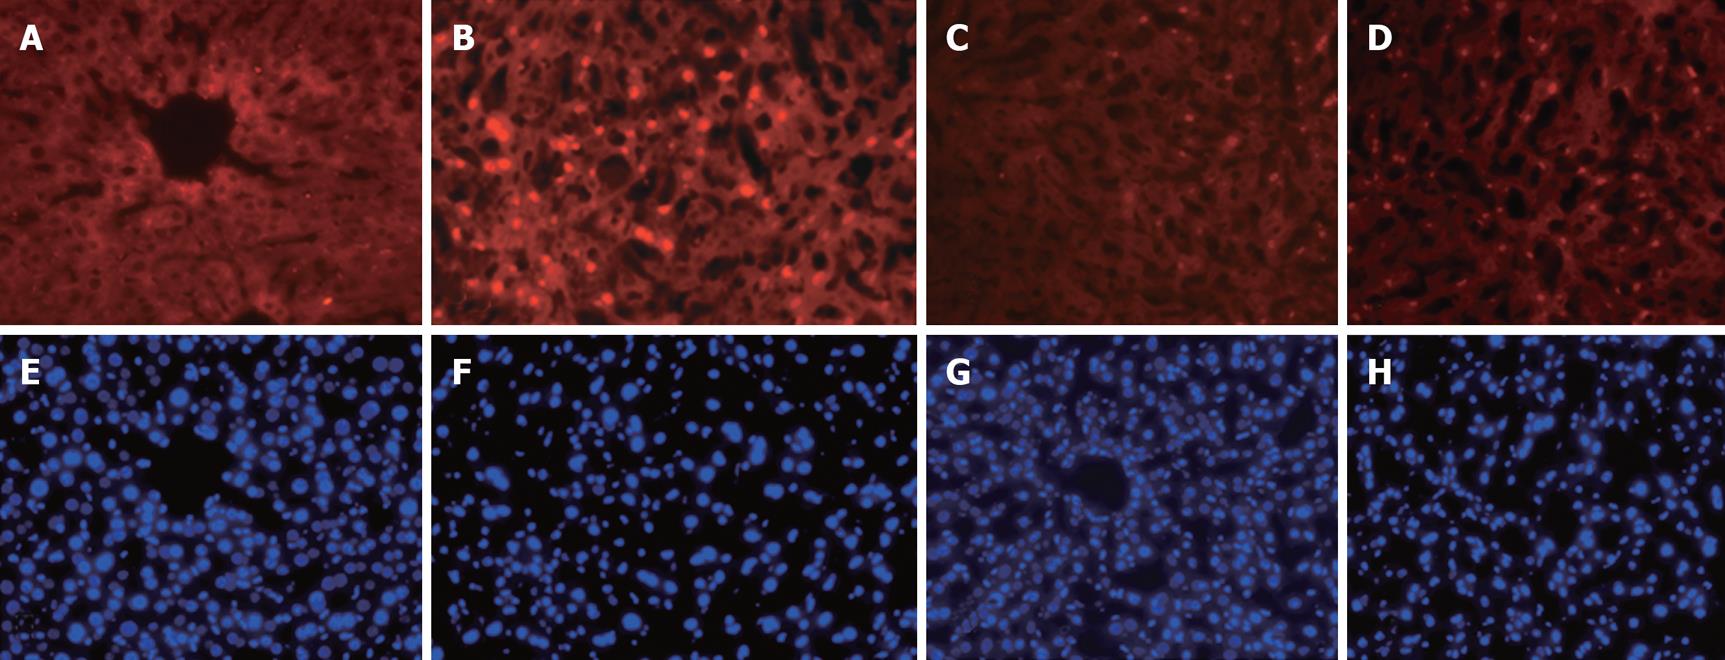
Figure 2 Representative micrographs of in situ TUNEL staining of apoptotic cells in liver tissue after the hepatic ischemia/reperfusion procedure.
A-D: The TUNEL staining assay was performed as described in the text, and the positive apoptotic cells were stained in red (× 100). A: Control; B: I/R procedure plus N.S. (6 h after starting reperfusion); C: I/R plus apocynin; D: I/R plus allopurinol. E-H: The corresponding liver sections stained with DAPI to illustrate nuclei as a cell number control.
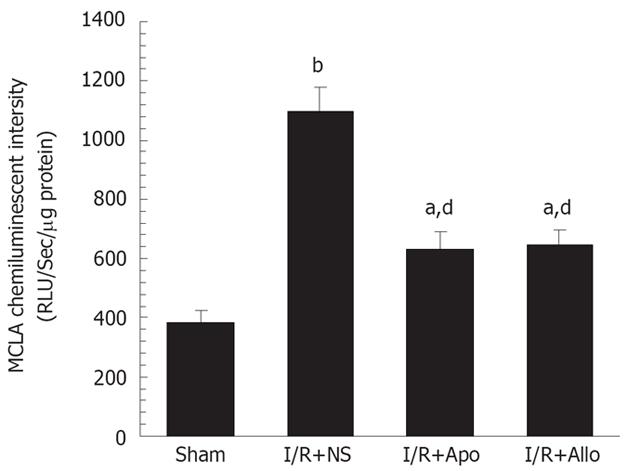
Figure 3 The hepatic I/R-induced superoxide anion production and the effects of apocynin or allopurinol in mouse liver.
The superoxide anion production was determined in mouse liver homogenates with a superoxide anion tracer, MCLA, and the MCLA chemiluminescent emission was recorded in a luminometer and expressed as relative light unit per second per micrograms of protein (mean ± SEM). aP < 0.05, bP < 0.01 vs the sham controls, dP < 0.01 vs the I/R procedure plus N.S. at 6 h time point.
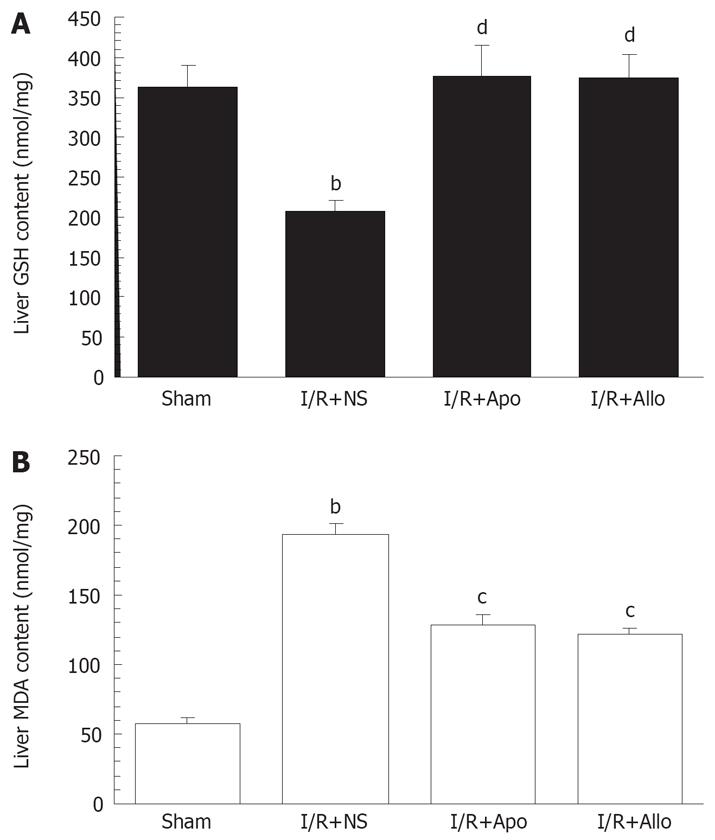
Figure 4 Hepatic I/R-induced depletion of reduced form of glutathione and enhanced lipid peroxidation, and effects of apocynin and allopurinol.
A: Effect of apocynin or allopurinol on liver GSH levels with the hepatic I/R procedure. Liver GSH content was determined spectrophotometrically and expressed as nanomoles per milligram of protein of the tissue; B: Effects of apocynin or allopurinol on liver MDA levels with I/R procedure. Liver MDA content was determined spectrophotometrically and expressed as nanomoles per milligram of tissue protein (mean ± SEM). bP < 0.01 vs Sham controls; cP < 0.05, dP < 0.01 vs the hepatic I/R procedure plus N.S. at 6 h time point (n = 6 in each group).
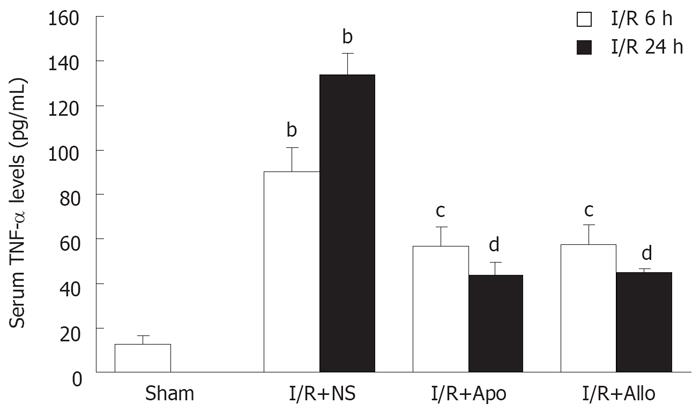
Figure 5 Effects of apocynin or allopurinol on serum TNF-α levels.
Serum TNF-α in mice with hepatic I/R-induced liver injury was measured by an enzyme-linked immunosorbent assay kit. bP < 0.01 vs Sham controls (mean ± SEM); cP < 0.05; dP < 0.01 vs I/R procedure plus N.S. at 6 or 24 h time point (n = 6 in each group).
- Citation: Liu PG, He SQ, Zhang YH, Wu J. Protective effects of apocynin and allopurinol on ischemia/reperfusion-induced liver injury in mice. World J Gastroenterol 2008; 14(18): 2832-2837
- URL: https://www.wjgnet.com/1007-9327/full/v14/i18/2832.htm
- DOI: https://dx.doi.org/10.3748/wjg.14.2832


