Copyright
©2008 The WJG Press and Baishideng.
World J Gastroenterol. Mar 28, 2008; 14(12): 1858-1865
Published online Mar 28, 2008. doi: 10.3748/wjg.14.1858
Published online Mar 28, 2008. doi: 10.3748/wjg.14.1858
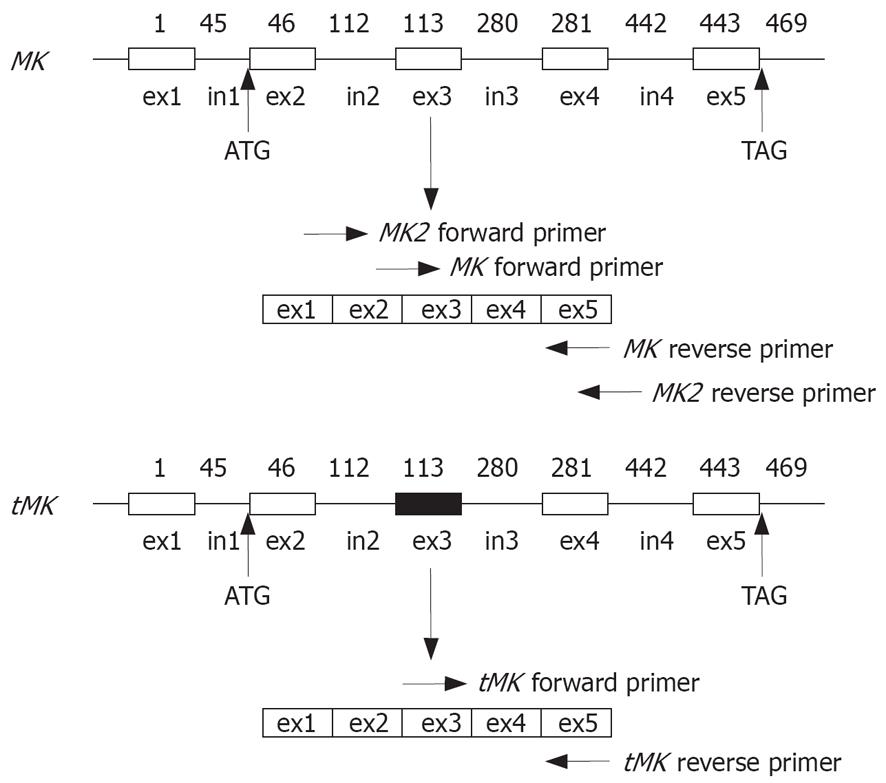
Figure 1 Illustration of MK and tMK gene DNA structures.
Box: Exon (ex); Line: Intron (in); Shaded box; Truncated portion; ATG: Start site; TAG: Terminal site; Numeric figures: Nucleotide position of the mRNA transcript. Arrowheads indicate the sites of primer complemented with MK or tMK mRNA.
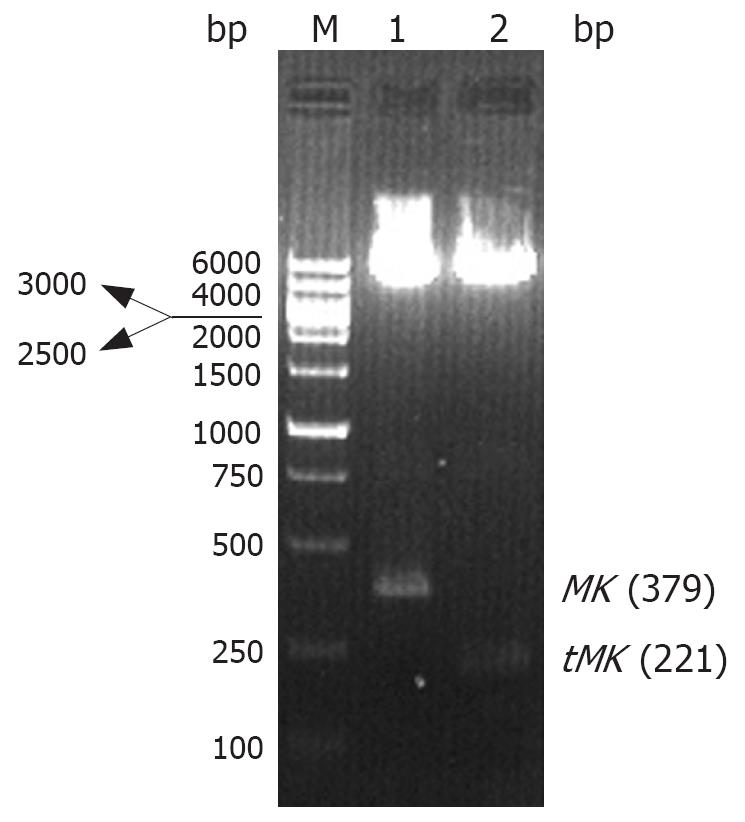
Figure 2 Restriction digestions of recombinant plasmids.
M: Wide range DNA marker 100-6000 (TaKaRa); Lane 1: pcDNA3.1/MK; Lane 2: pcDNA3.1/tMK.
Figure 3 RT-PCR (A, B) and Western blotting (C) analysis of the expression of MK or tMK in BGC823 after transfection.
A and B, M: DNA molecular weight standards, DL2000 (TaKaRa); Lane 1 and 4: BGC823; Lane 2 and 5: BGC823/vector; Lane 3: BGC823/MK; Lane 6: BGC823/tMK. C, Lane 1: BGC823/MK; Lane 2: BGC823/tMK; Lane 3: BGC823/vector; Lane 4: BGC823.
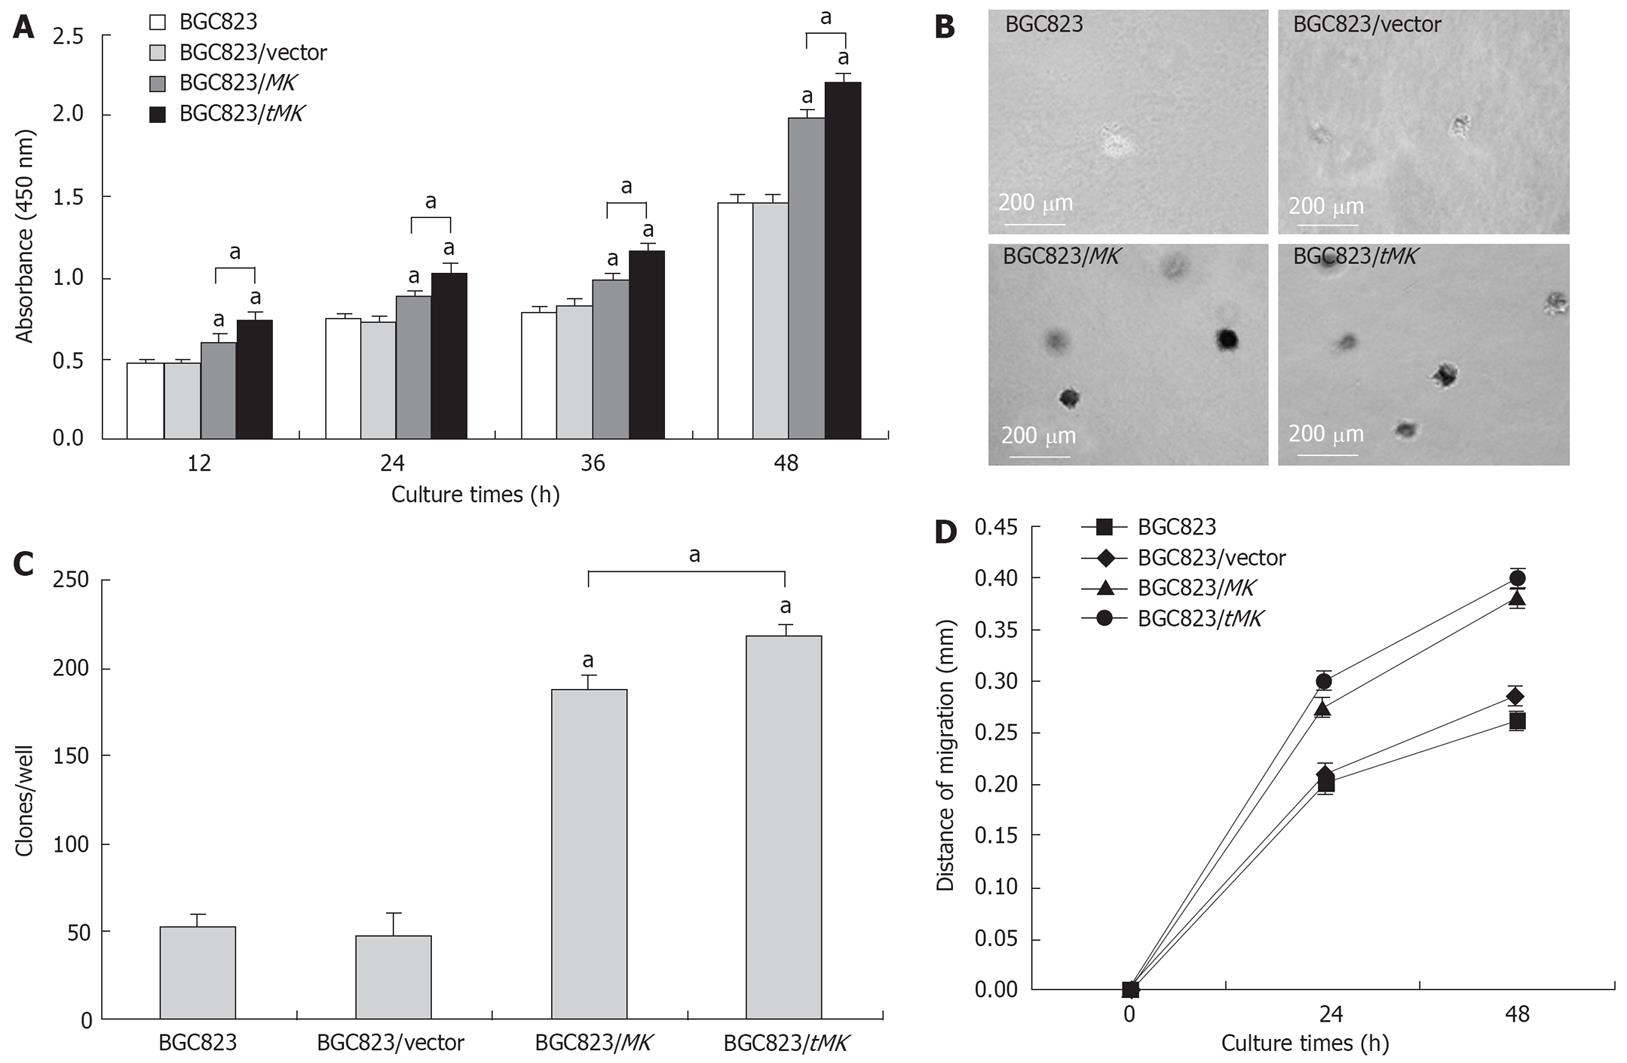
Figure 4 Effects of over-expressed MK or tMK on BGC823 cells in vitro.
A: The cell proliferation determined by Cell Counting Kit (P < 0.05); B: Colony formation in soft agar observed under light microscope; C: Comparison of colony numbers. D: Analysis of cell migration.
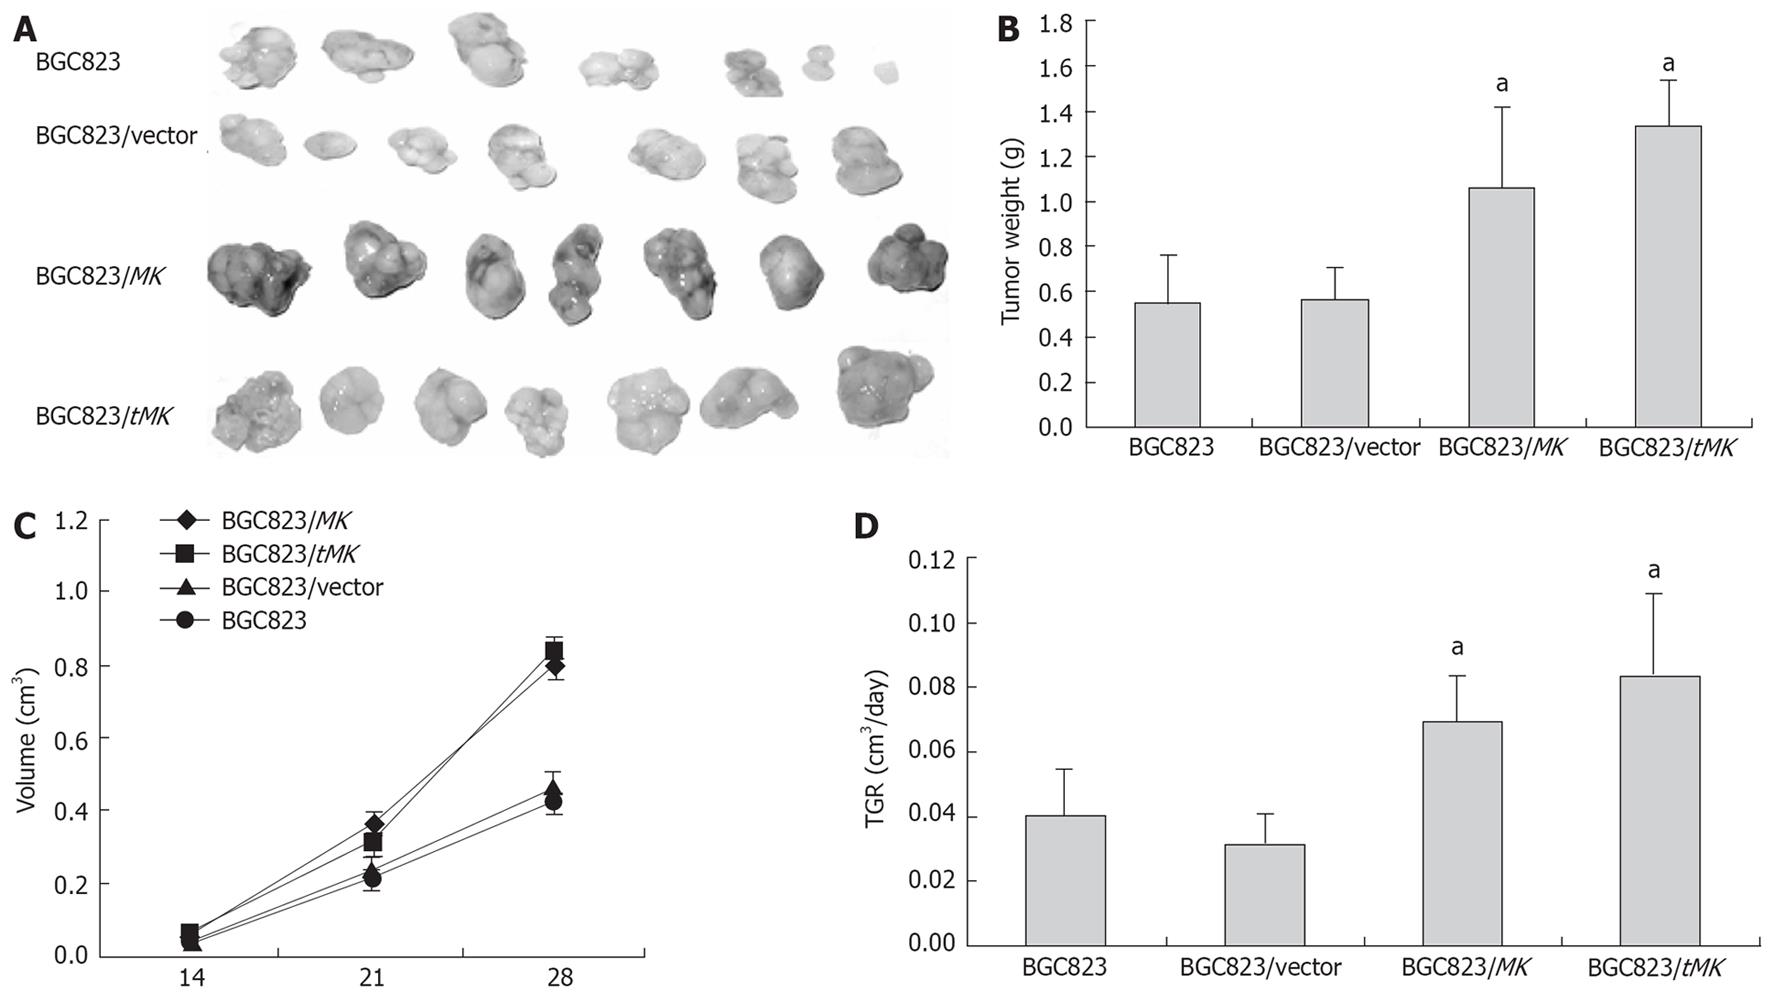
Figure 5 Promotion of tumorigensis of MK- or tMK- transfected cells in vivo.
A: Photograph of tumor size; B: Comparison of tumor weight (P < 0.05); C: Measure of tumor volume (aP < 0.05); D: Analysis of tumor growth rate (aP < 0.05).
Figure 6 Immunohistochemical staining of tissues for MK and tMK with rabbit polyclonal anti-MK antibody.
A: Negative control sections; B: Tumor tissue from BGC823 injected mice; C: Tumor tissue from BGC823/vector injected mice; D: Tumor tissue from BGC823/MK injected mice; E: Tumor tissue from BGC823/tMK injected mice (× 200). Arrows represent positive results of MK or tMK expressions.
-
Citation: Wang QL, Wang H, Zhao SL, Huang YH, Hou YY. Over-expressed and truncated midkines promote proliferation of BGC823 cells
in vitro and tumor growthin vivo . World J Gastroenterol 2008; 14(12): 1858-1865 - URL: https://www.wjgnet.com/1007-9327/full/v14/i12/1858.htm
- DOI: https://dx.doi.org/10.3748/wjg.14.1858


