Copyright
©2008 The WJG Press and Baishideng.
World J Gastroenterol. Mar 21, 2008; 14(11): 1749-1758
Published online Mar 21, 2008. doi: 10.3748/wjg.14.1749
Published online Mar 21, 2008. doi: 10.3748/wjg.14.1749
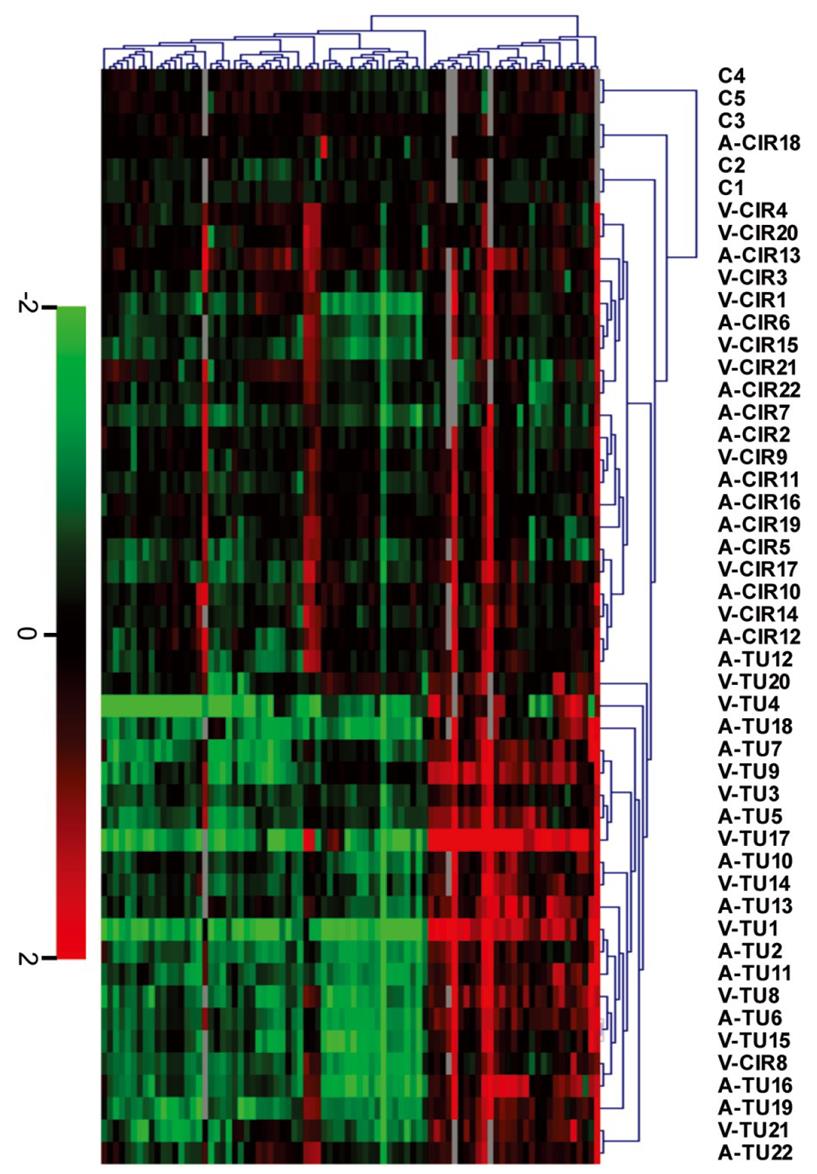
Figure S1 Sample clustering: Tumor vs cirrhosis.
Unsupervised hierarchical clustering of 5 control livers (C) and paired HCC nodule (TU) and surrounding cirrhosis (CIR) (44 samples from patients 1 to 22, see clinical data in Table 1) shown from left to right was based upon 81 transcripts (84 probes) shown rom top to bottom. Transcript levels were expressed as a ratio [level in sample/mean level in controls] and 81 transcripts were next selected as informative transcripts by SAM. The patients are listed on top (V, HCV; A, alcoholism). Scale bar (log2 ratio): decreased (green), increased (red) or identical mRNA level (black) in any sample vs controls. Gray squares are missing values.
Figure 1 Etiology-dependent location of dysregulated genes.
A total of 475 genes (HCV, 301 genes; alcoholism, 174 genes) with a dysregulated transcript were studied. Dysregulated transcripts were defined by an abnormal (tumor/cirrhosis) ratio in at least 3 patients of at least one etiology group (see details in Table 2, footnote 3). The number of dysregulated genes per chromosome is expressed as a percentage of the total number of dysregulated genes per etiology. Significant differences of gene frequency on a given chromosome in HCV vs alcoholic patients are: chr 2, P = 0.004; chr 8, P = 0.02 (Chi square test with Yates’ correction), aP≤ 0.02.
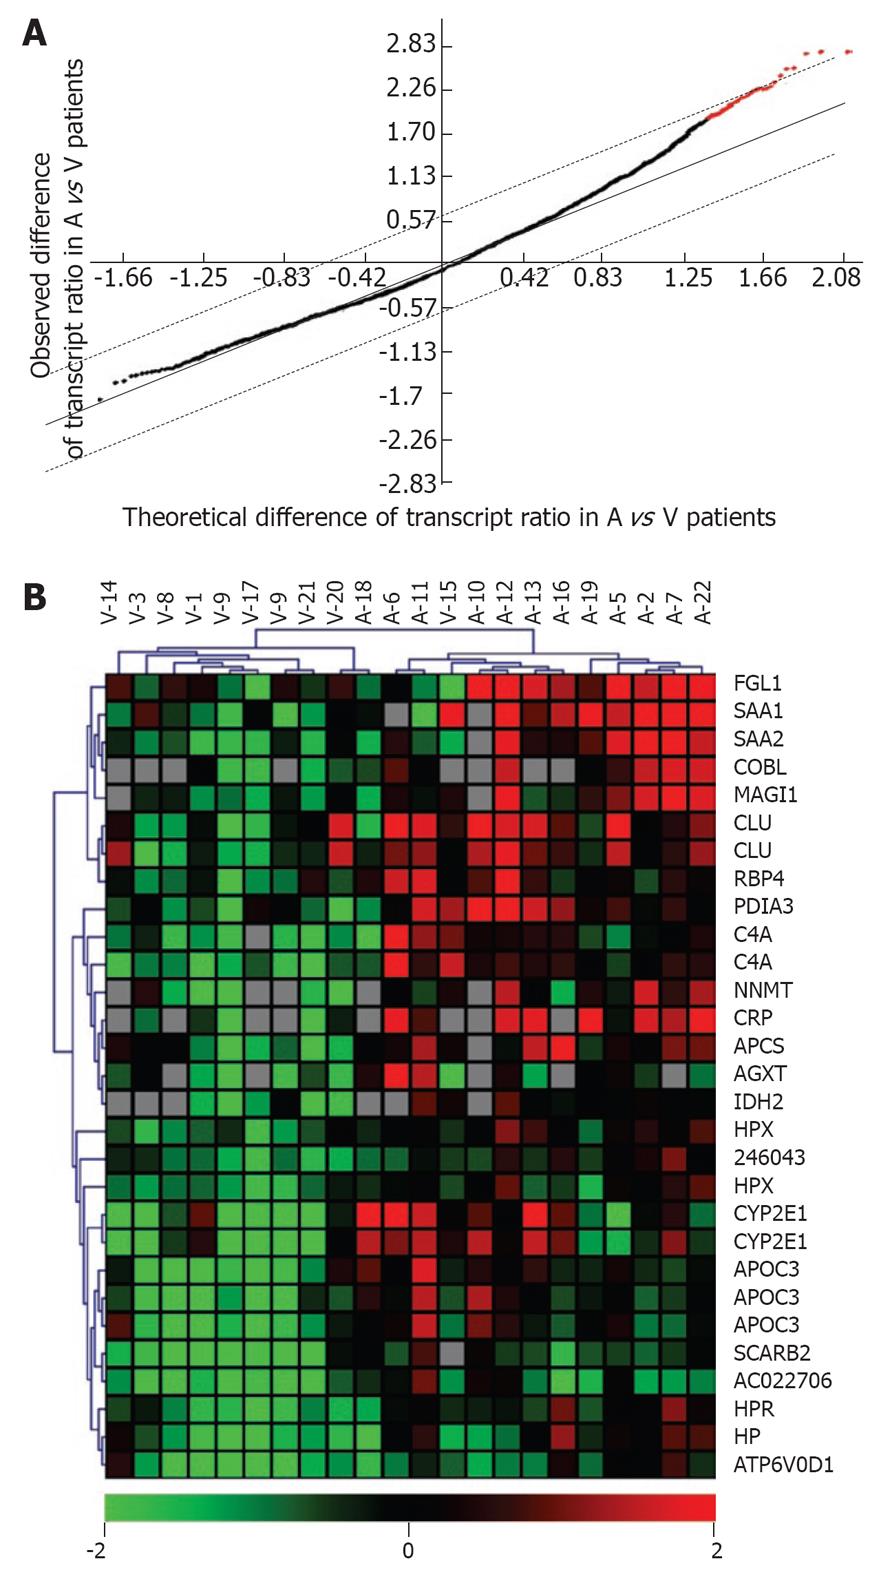
Figure 2 Etiology-dependent clustering of patients with (tumor/cirrhosis) ratios.
A: Selection of transcripts with a significantly abnormal ratio of abundance in (tumor/paired cirrhosis). Black + red dots: 2730 transcripts with an abnormal ratio in at least 1/22 patients. Red dots: 23 informative transcripts (29 probes) with a significantly increased ratio in alcoholic vs HCV patients as selected by SAM with an FDR < 1%; B: UHC of 22 HCC patients with the above 23 transcripts. Note that the misclassification of two samples (A18, V15) was further evaluated by a jacknife procedure (1000 iterations) which supported cluster assignment to a variable extent (A18, < 50%; V15, 100%). Note that several transcripts were each detected with 2 or more different cDNA probes. Bottom scale bar: decreased (green), increased (red) or identical ratio (black). Gray squares are missing values. All data given on a log2 scale.
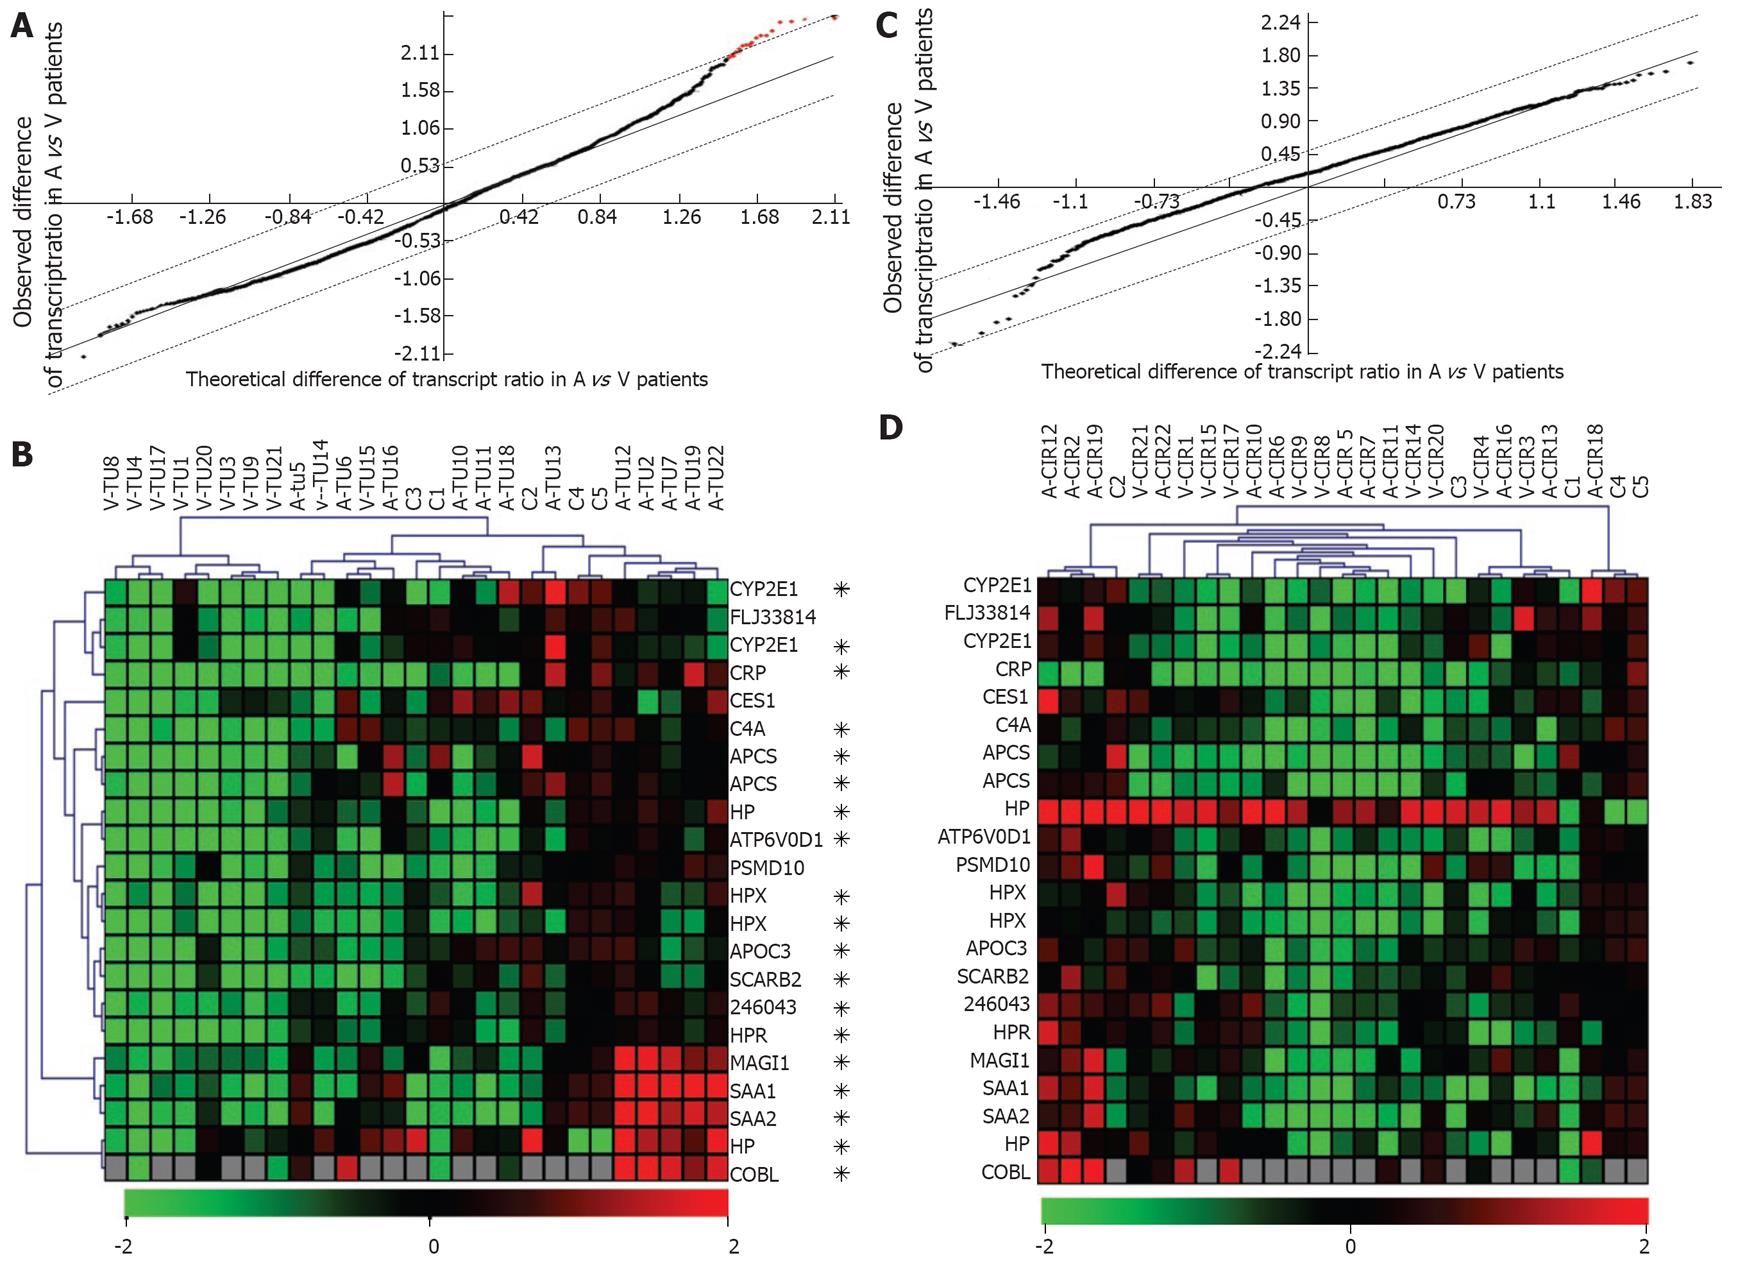
Figure 3 Etiology-dependent clustering of tumors only, with (tumor/controls) ratios.
A: Selection of transcripts with a significantly abnormal (level in tumor/mean level in controls) ratio. Black + red dots: 2641 transcripts with an abnormal ratio in at least 1/22 patients. Red dots: SAM selection of 18 informative transcripts (22 probes) with a significantly increased (tumor/controls) ratio in alcoholic vs HCV patients. SAM parameters as in Figure 2; B: UHC of 5 control livers and 22 tumors from 22 HCC patients, as done with the data of the 18 informative transcripts selected in A; The stars point to 15 transcripts (19 probes) that also belonged to the set of 23 transcripts previously selected in Figure 2; C: Selection of transcripts with a significantly abnormal (level in cirrhosis/mean level in controls) ratio. Black dots: 2037 transcripts with an abnormal ratio in at least 1/22 patients. No informative transcript was selected by SAM (no red dot); D: UHC of 5 control patients and 22 HCC-associated cirrhotic samples from 22 HCC patients, as done with the list of 18 transcripts used in B. Other details as in Figure 2.
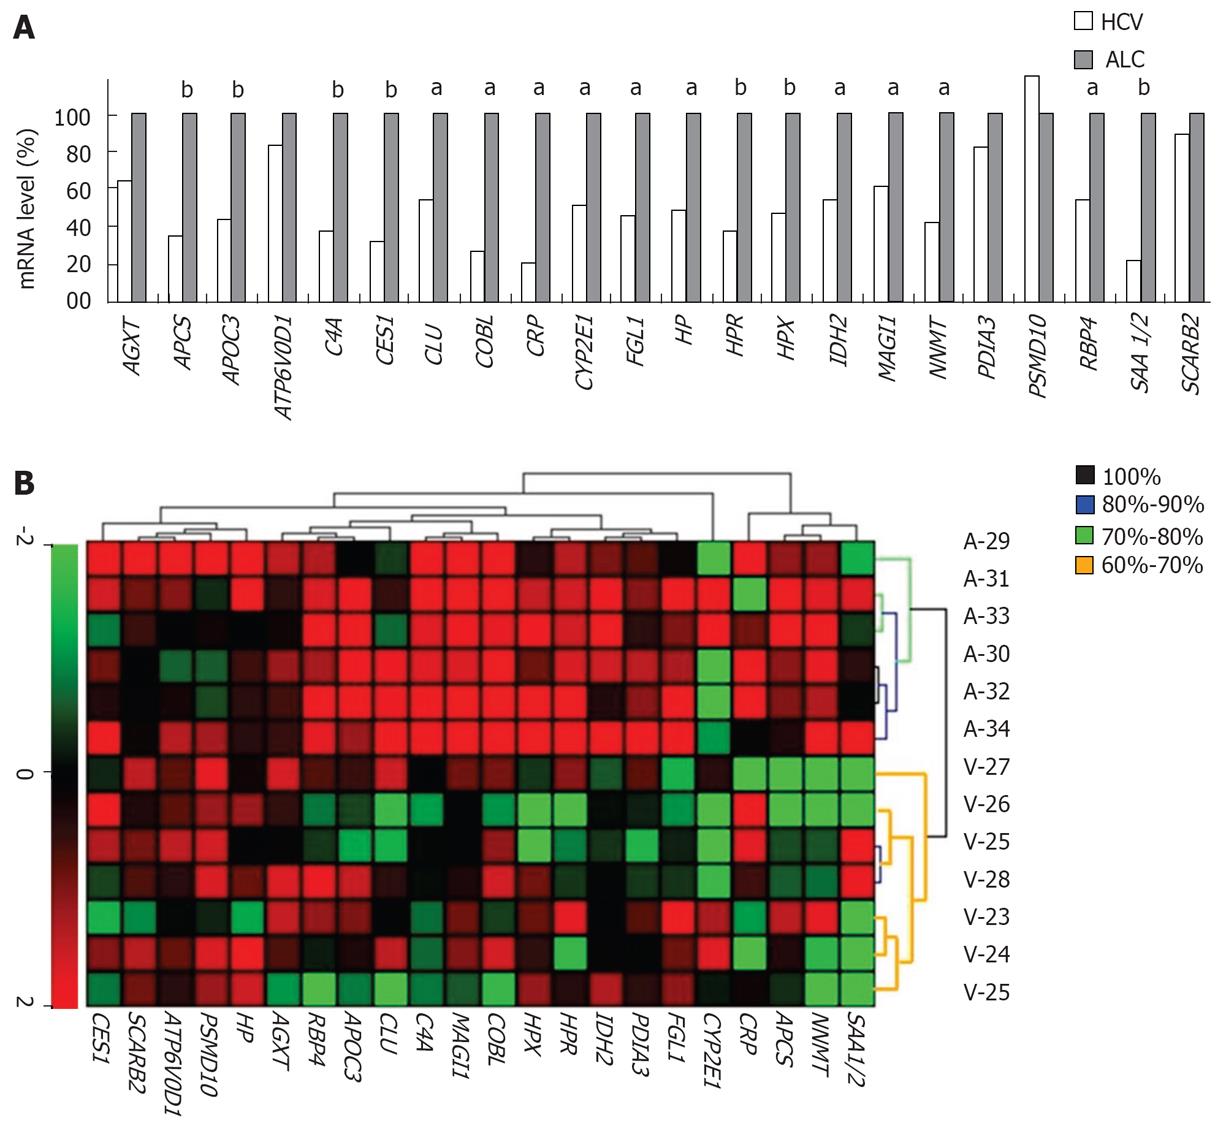
Figure 4 Data validation by qRTPCR of tumor mRNAs.
The levels of 23 transcripts (listed from Figures 2A and 3A; SAA1 and -2 are counted as 2 transcripts) were determined in tumors and normalized with the 18S RNA level. A: Every histogram depicts the mean transcript level in all patients from Table 1 (n = 35) and is expressed as a percentage of the mean level in alcoholic patients (100%). Mann and Whitney’s test (aP < 0.05; bP < 0.01). B: UHC made with qRTPCR data from our test set (n = 13). The colors in dendrogram indicate the percentage of iterations reproducibly providing the same separation. Note the significant separation of 2 major, etiology-related branches (black branches found in 100% of 103 iterations).
-
Citation: Derambure C, Coulouarn C, Caillot F, Daveau R, Hiron M, Scotte M, François A, Duclos C, Goria O, Gueudin M, Cavard C, Terris B, Daveau M, Salier JP. Genome-wide differences in hepatitis C-
vs alcoholism-associated hepatocellular carcinoma. World J Gastroenterol 2008; 14(11): 1749-1758 - URL: https://www.wjgnet.com/1007-9327/full/v14/i11/1749.htm
- DOI: https://dx.doi.org/10.3748/wjg.14.1749


