Copyright
©2008 The WJG Press and Baishideng.
World J Gastroenterol. Jan 7, 2008; 14(1): 76-80
Published online Jan 7, 2008. doi: 10.3748/wjg.14.76
Published online Jan 7, 2008. doi: 10.3748/wjg.14.76
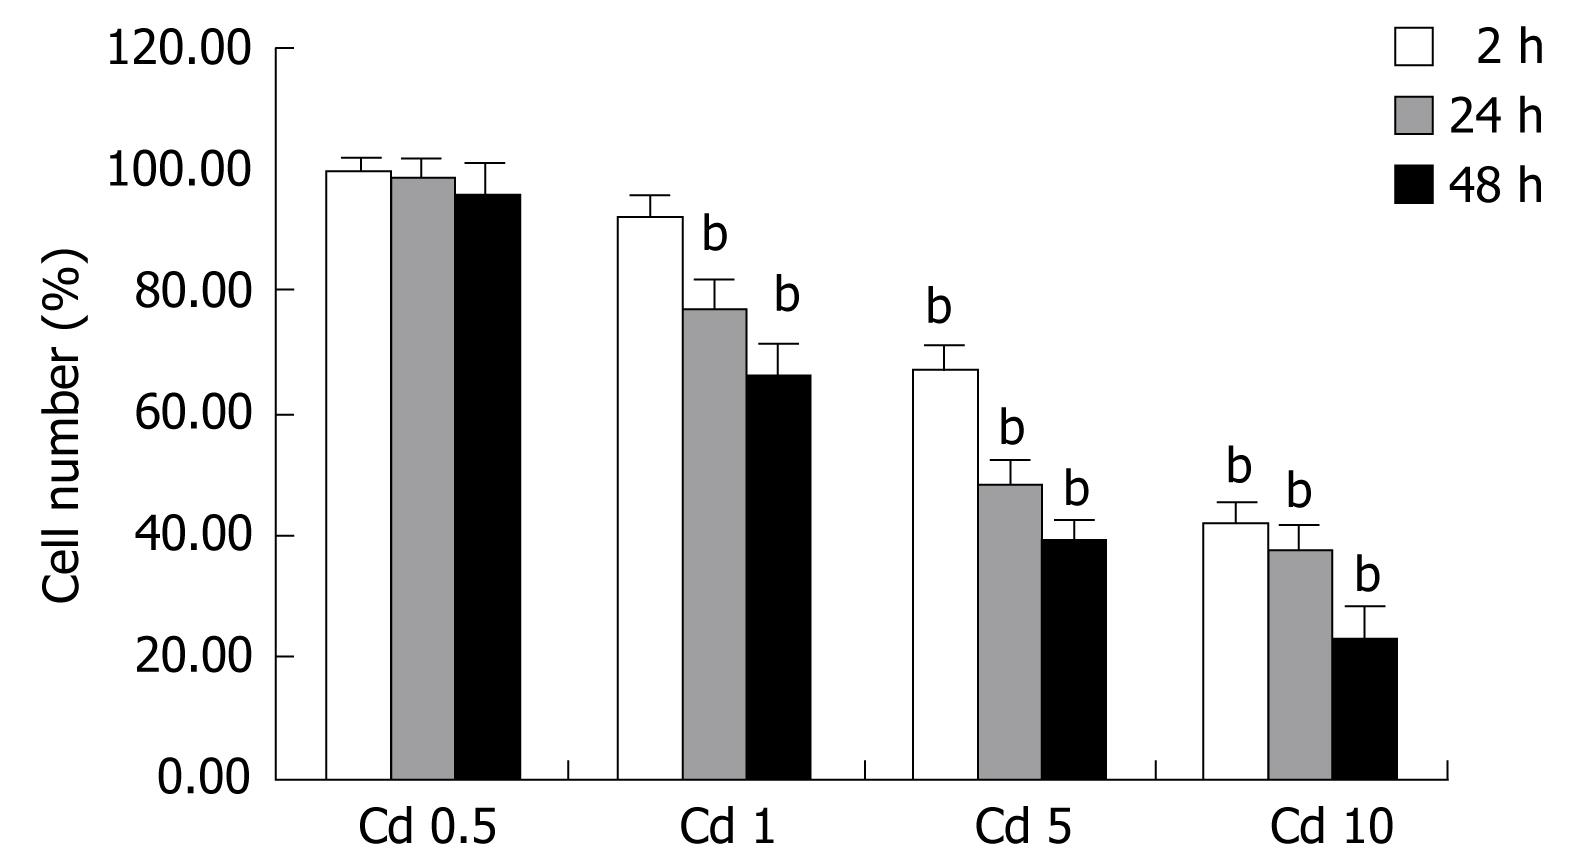
Figure 1 Cell death (%) was determined at 2nd, 24th and 48th h by the MTT assay.
Cd exposure induced prominent cell death in Hep3B hepatocytes with dose and time dependent manner. Data are from 6 independent experiments for each condition. Data are presented as mean ± SEM. bP < 0.001 vs control group.
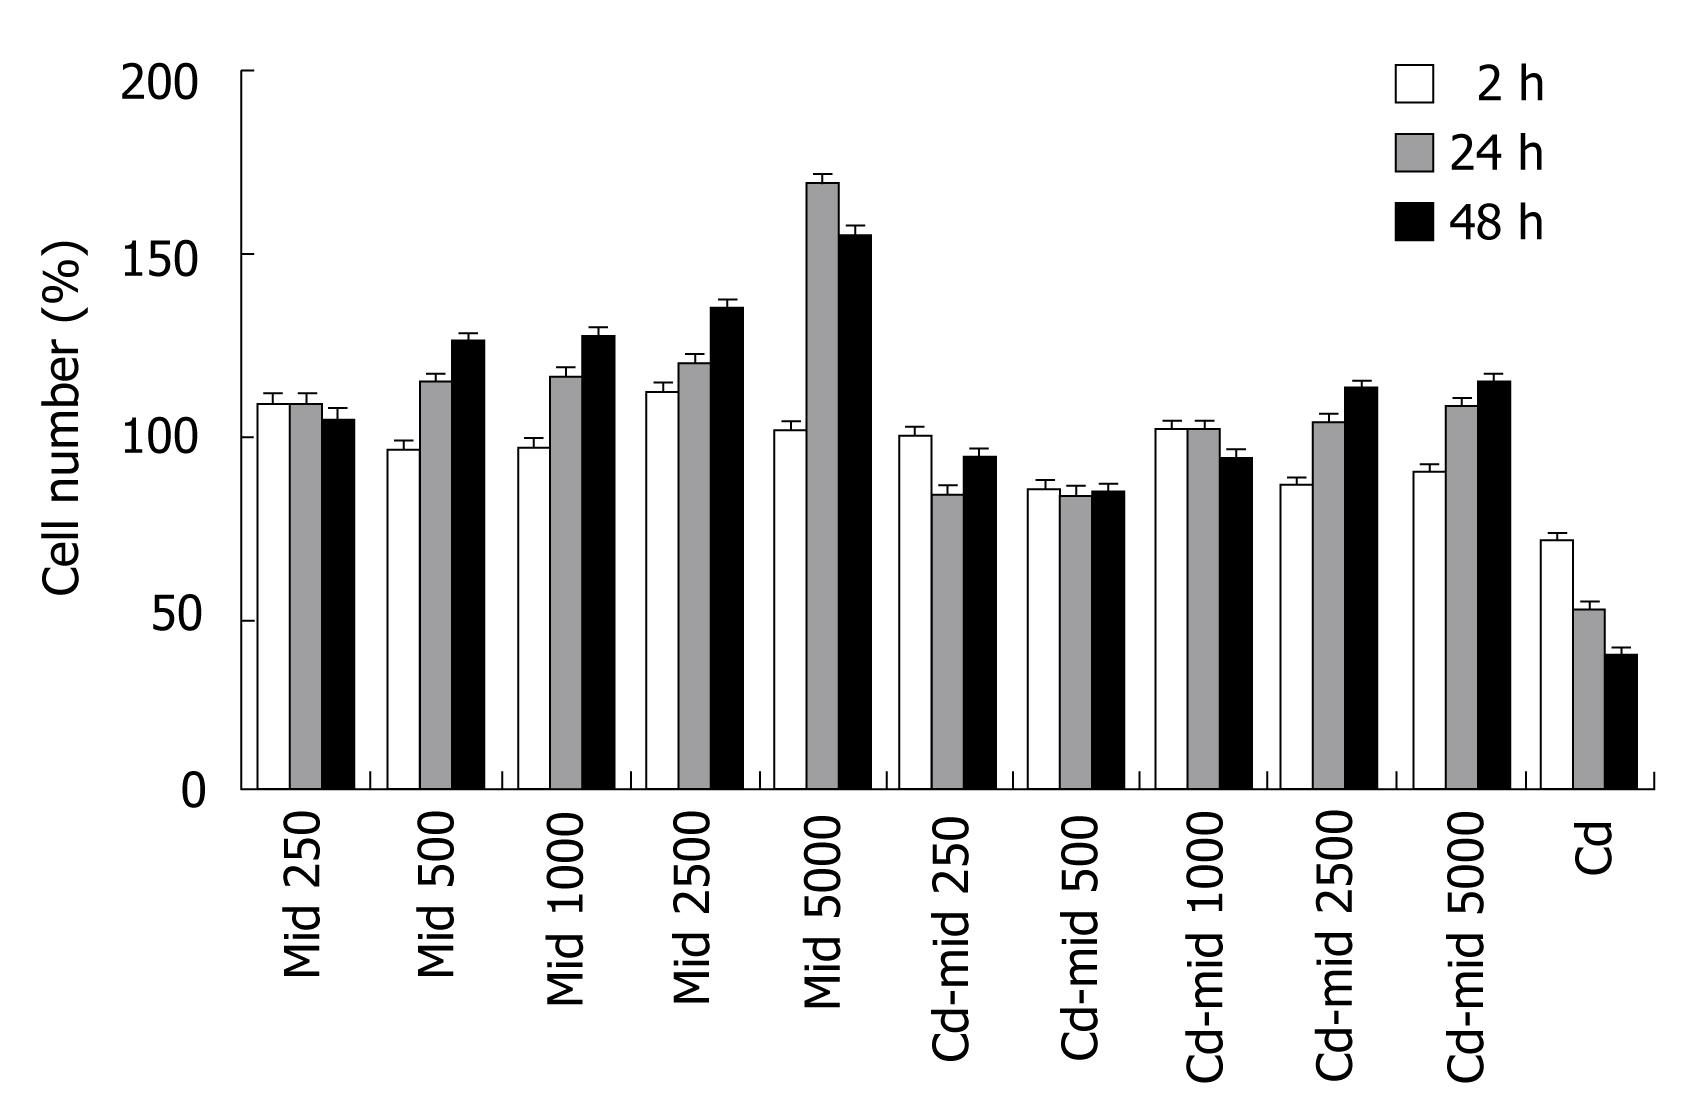
Figure 2 Cell number (%) was determined by MTT assay following 2nd, 24th and 48th h exposure to 250-5000 pg/mL and/or 5 &mgr;g/mL Cd.
Midkine treatment increased cell proliferation in Hep3B hepatocytes with dose and time dependent manner. Data are presented as mean ± SEM.
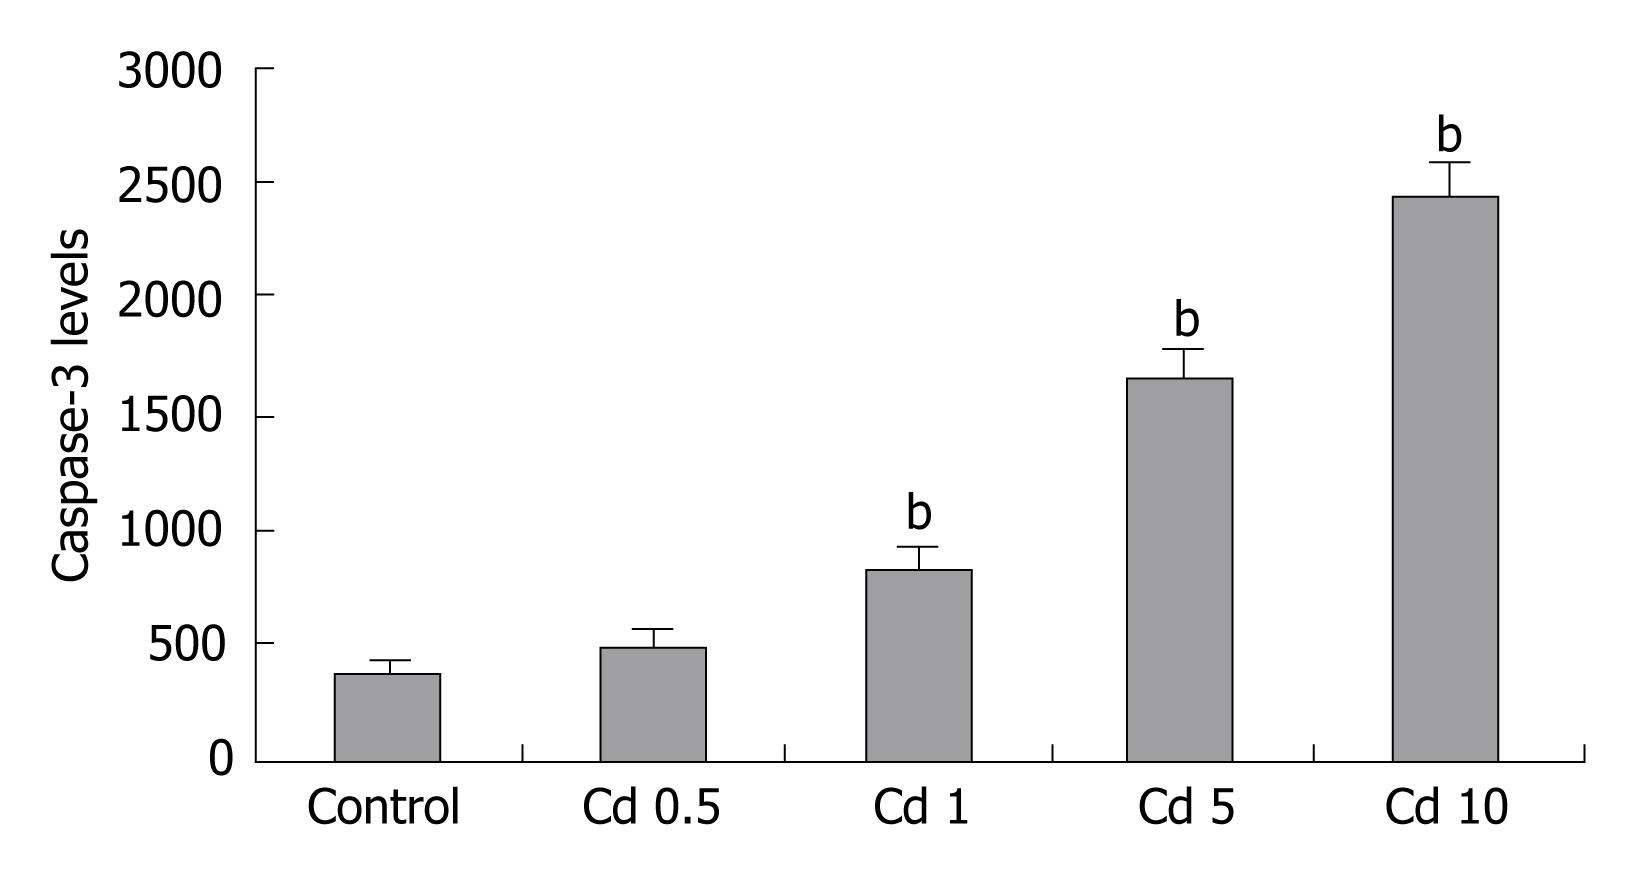
Figure 3 Caspase-3 levels were measured following a 48 h exposure to 0.
5-10 &mgr;g/mL Cd. Data were given as mean ± SEM. bP < 0.001 vs control group.
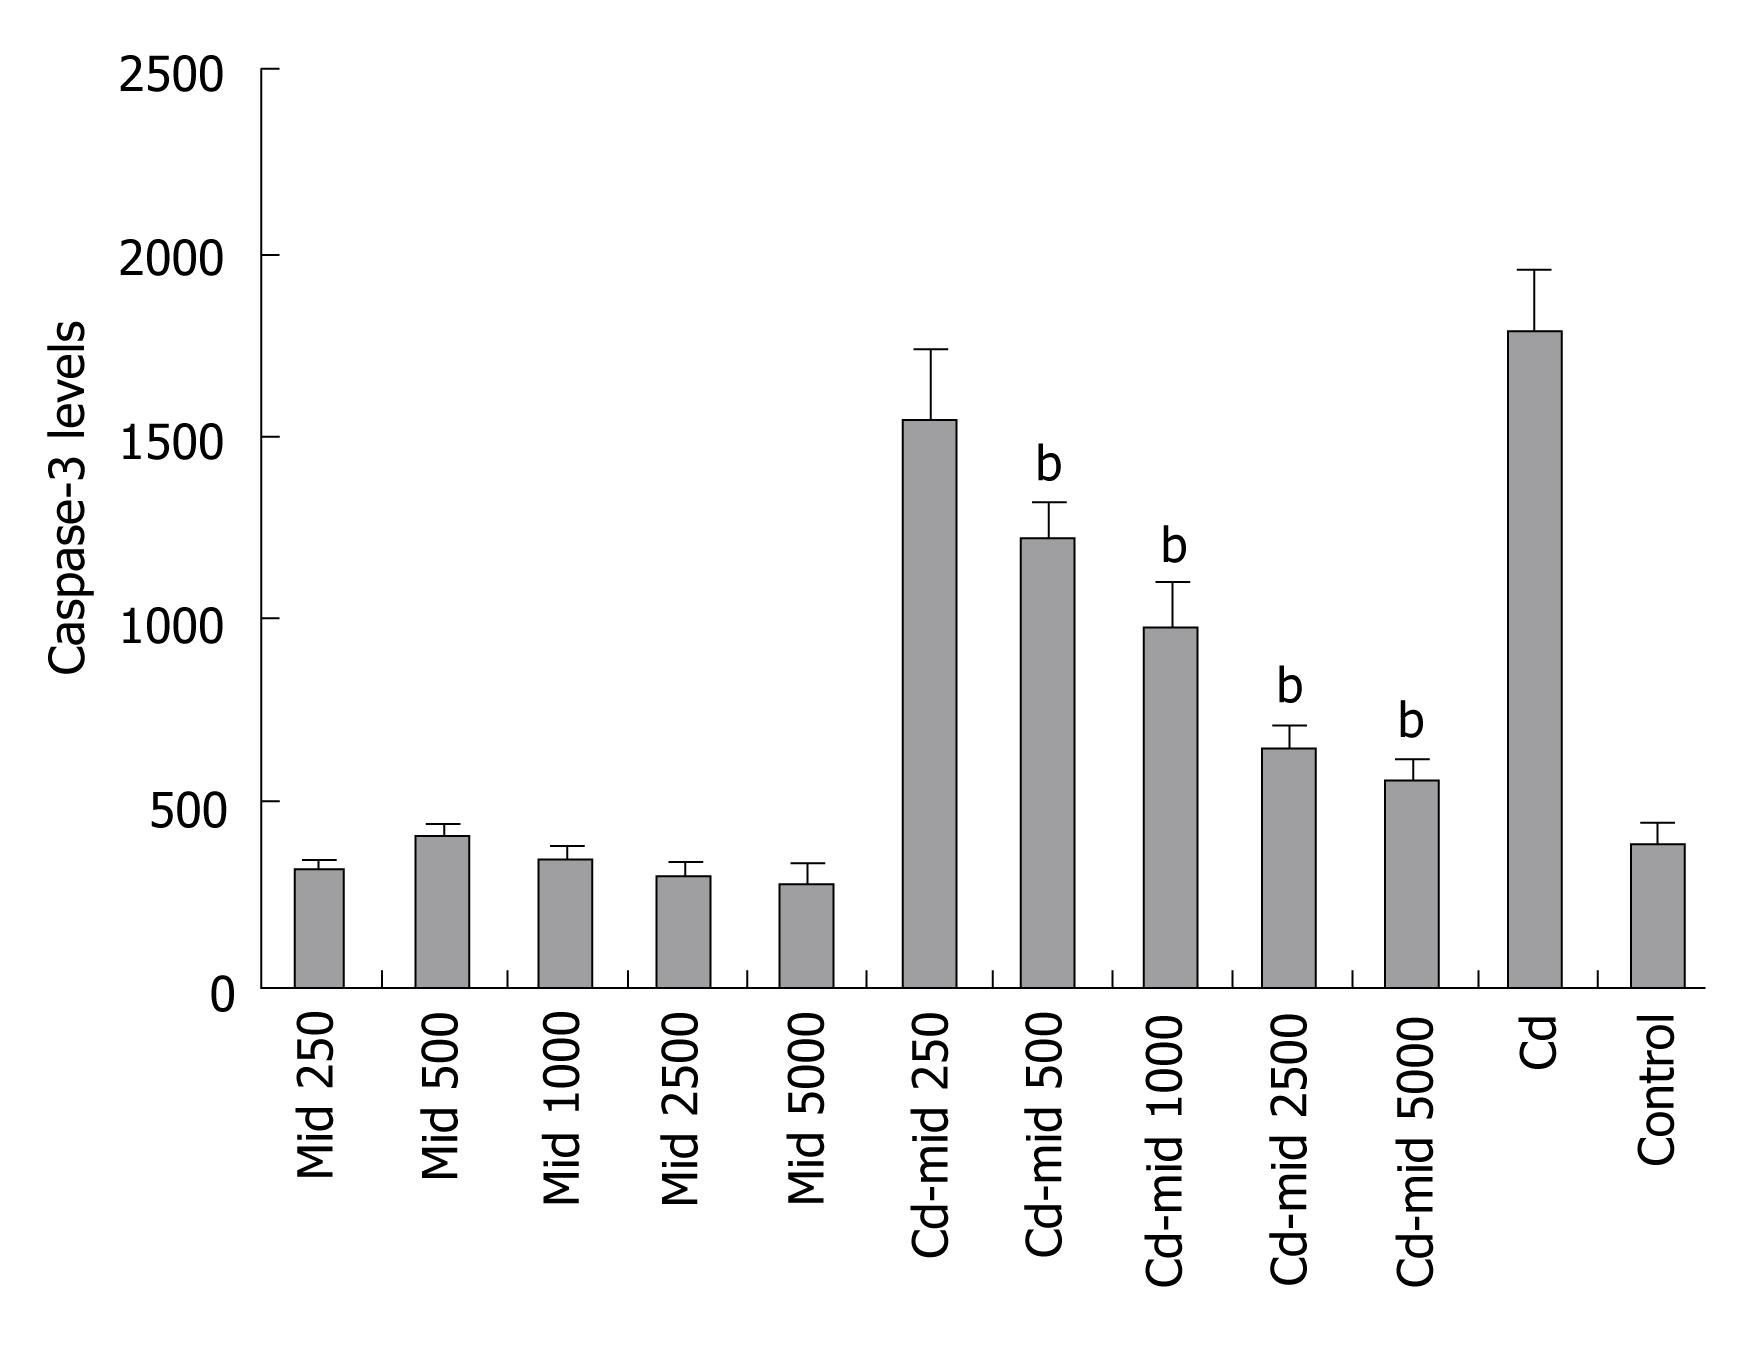
Figure 4 Caspase-3 levels were measured following a 48 h of exposure to 250-5000 pg/mL Midkine and/or 5 &mgr;g/mL Cd.
Data are presented as mean ± SEM. bP < 0.001 vs control group.
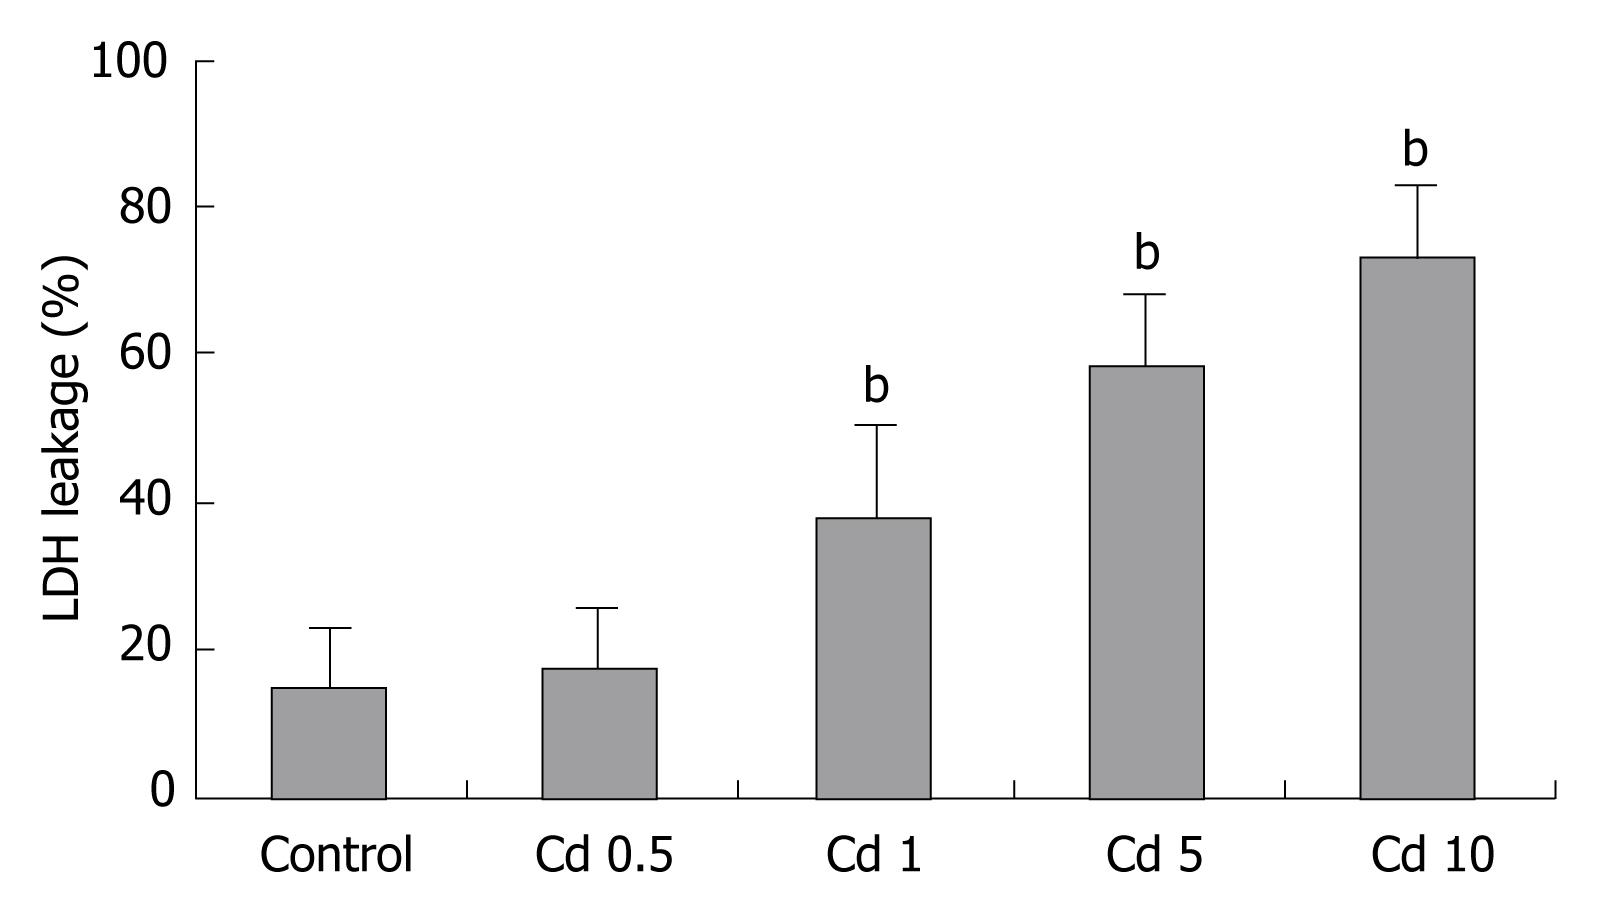
Figure 5 Cd induced cytotoxicity at the 48th h of experiment determined by % LDH released to medium.
Starting from the 1 &mgr;g/mL dosage Cd treatment caused prominent LDH release from hepatocytes at the end of 48th h (P < 0.001). Data are presented as mean ± SEM. bP < 0.001 vs control group.
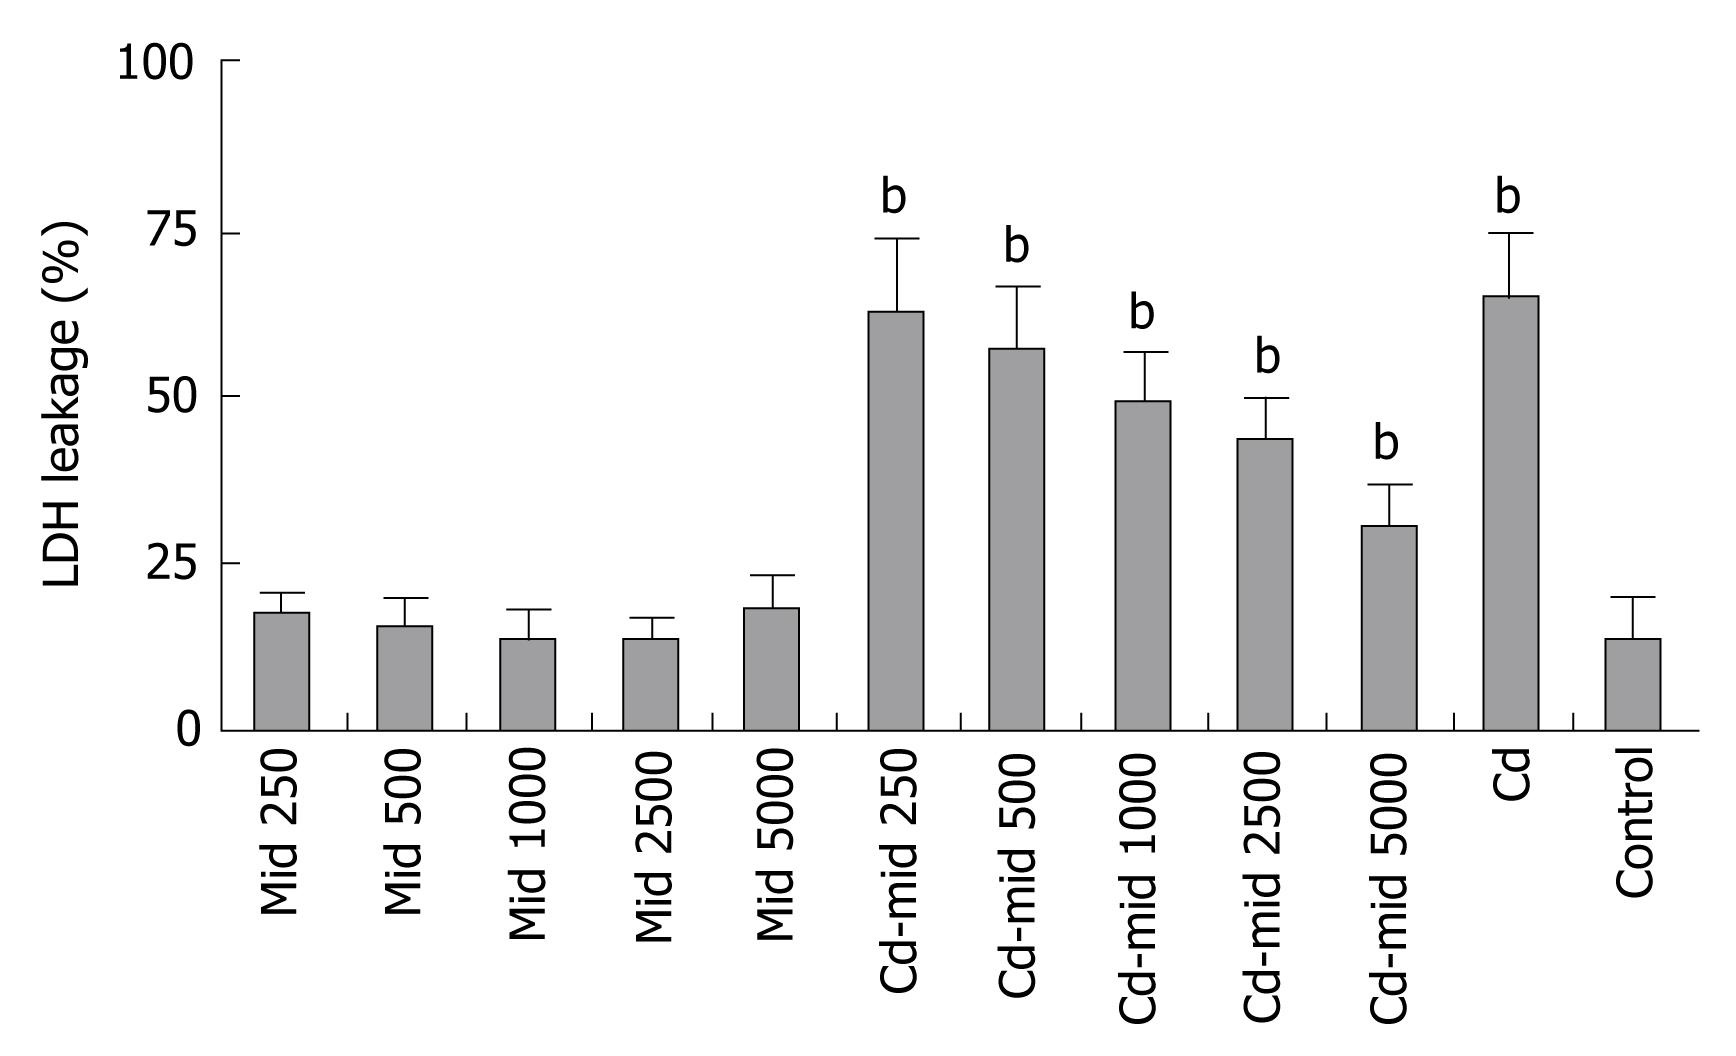
Figure 6 Effects of 48 h midkine (250-5000 pg/mL) and/or 5 &mgr;g/mL Cd treatment on the LDH leakage in the Hep3B cells.
Data are presented as mean ± SEM. bP < 0.001 vs control group.
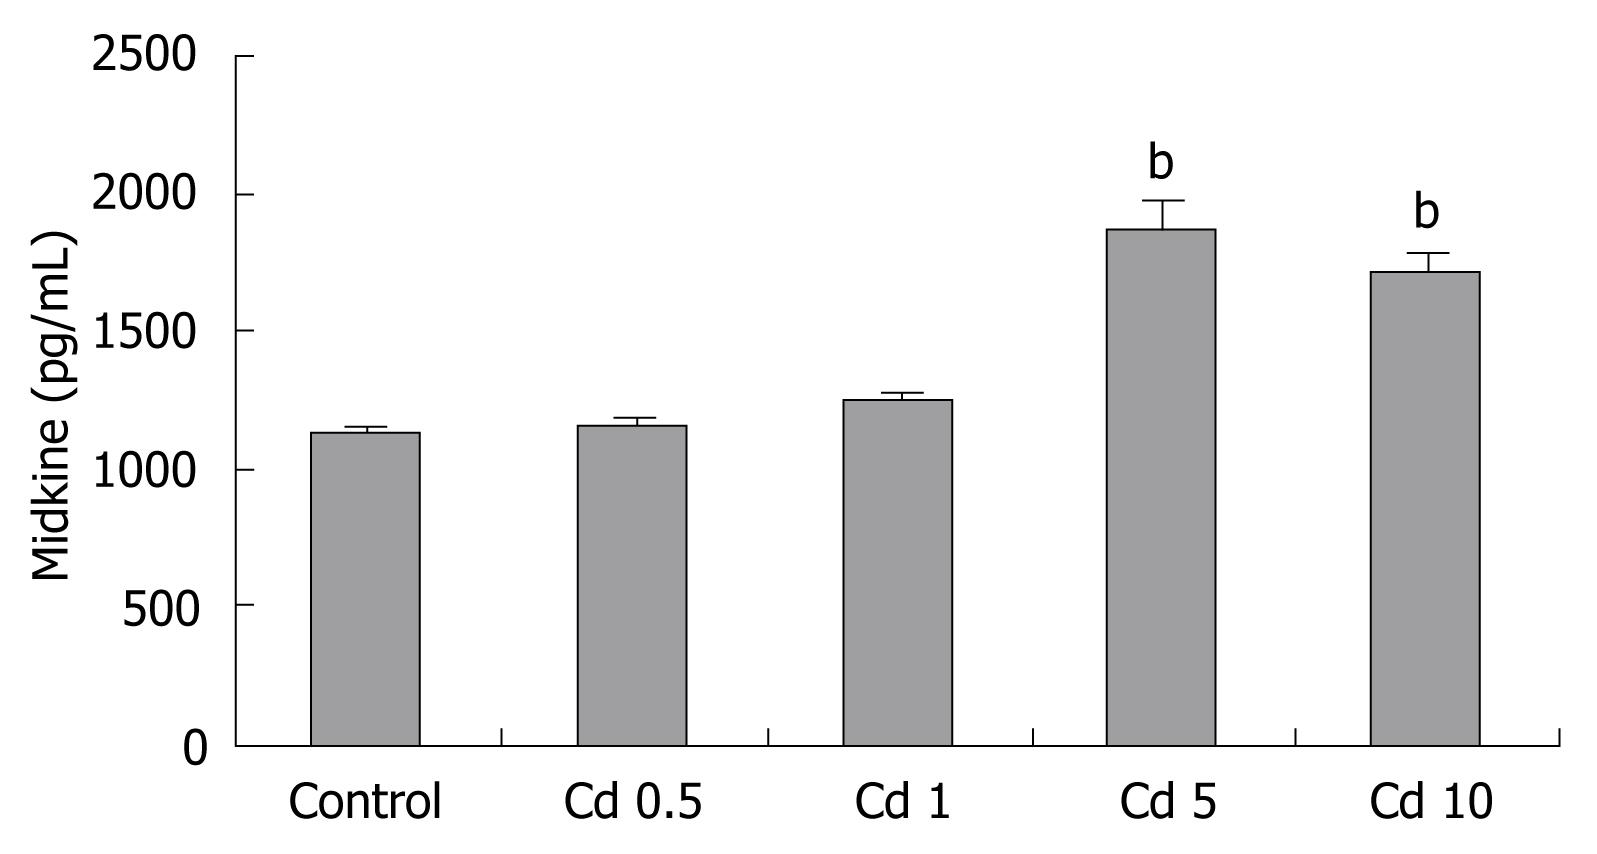
Figure 7 Effects of 0.
5-10 &mgr;g/mL Cd treatment on midkine secretion in the Hep3B cells. With 0.5 and 1 &mgr;g/mL Cd exposure we obtained similar midkine secretion as untreated cells. Midkine secretion was highest as a response to 5 &mgr;g/mL Cd treatment dosage. Data are presented as mean ± SEM. bP < 0.001 vs control group.
- Citation: Yazihan N, Ataoglu H, Akcil E, Yener B, Salman B, Aydin C. Midkine secretion protects Hep3B cells from cadmium induced cellular damage. World J Gastroenterol 2008; 14(1): 76-80
- URL: https://www.wjgnet.com/1007-9327/full/v14/i1/76.htm
- DOI: https://dx.doi.org/10.3748/wjg.14.76


