Copyright
©2007 Baishideng Publishing Group Co.
World J Gastroenterol. Feb 28, 2007; 13(8): 1162-1169
Published online Feb 28, 2007. doi: 10.3748/wjg.v13.i8.1162
Published online Feb 28, 2007. doi: 10.3748/wjg.v13.i8.1162
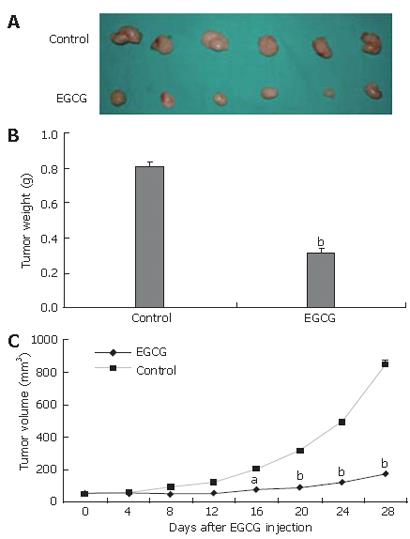
Figure 1 Inhibition of growth of human gastric cancer xenografts in an athymic mouce model.
A: tumor tissues treated with EGCG or PBS on d 28 after treatment; B: an average of 60.4% suppression of primary tumor growth in the EGCG treatment group compared with control group; C: tumor growth suppression curve: volumes of EGCG treatment group versus PBS treatment group on indicated days. Data are presented as mean ± SE (n = 6, aP < 0.05, bP < 0.01).
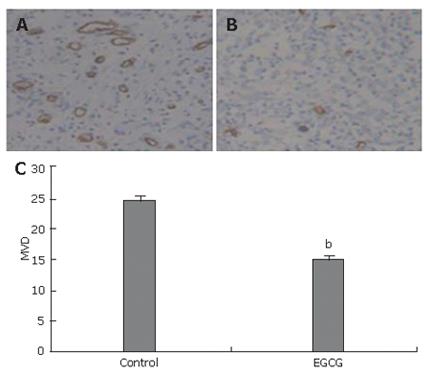
Figure 2 MVD in tumor tissues determined by a specific antibody against mouse endothelial CD34 in PBS group (A) and EGCG group (B) (200 ×) while quantitative analysis showing significant reduction of tumor MVD after EGCG treatment (C).
Data are presented as mean ± SE (n = 6, bP < 0.01).
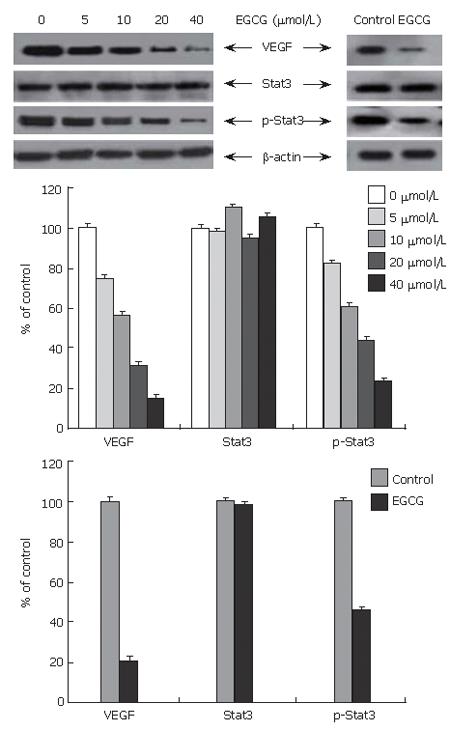
Figure 3 Suppression of VEGF expression and Stat3 activation in tumor cells and tissues by EGCG.
Protein level of VEGF and phosphorylated Stat3 was dose-dependently reduced in tumor cells treated with EGCG and also markedly in EGCG treated tumor tissues. EGCG did not change expression of Stat3 in tumor cells or tumor tissues.
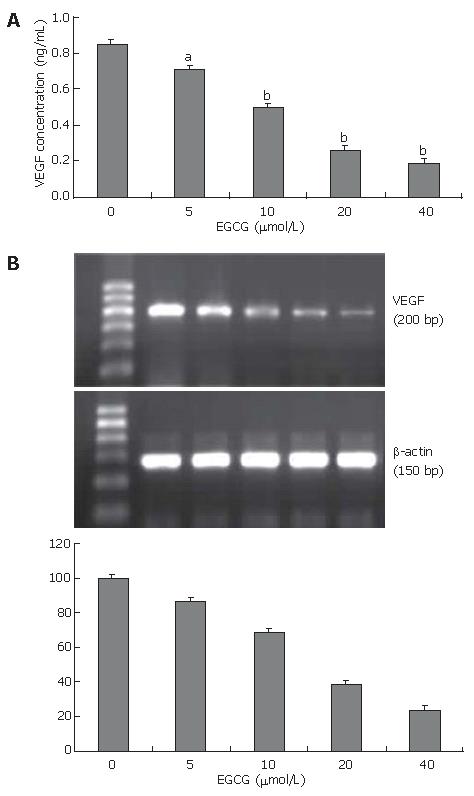
Figure 4 Decreased VEGF secretion (A) and inhibition of of VEGF mRNA expression (B) in tumor cells.
SGC-7901 cells were treated with various concentrations of EGCG for 24 h and VEGF protein level in the supernatant was measured by ELISA and mRNA expression in tumor cells was examined by RT-PCR. Data are presented as mean ± SE (n = 3, aP < 0.05, bP < 0.01).
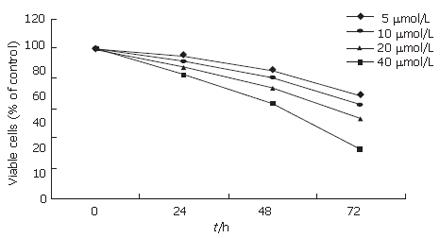
Figure 5 Inhibitory effects of EGCG on VEGF-induced proliferation of endothelial cells.
HUVECs were treated with 20 ng/mL VEGF and EGCG at the indicated concentration and time. EGCG time- and dose-dependently inhibited HUVEC proliferation induced by VEGF. Values are expressed as percent of control (means ± SE, n = 3).
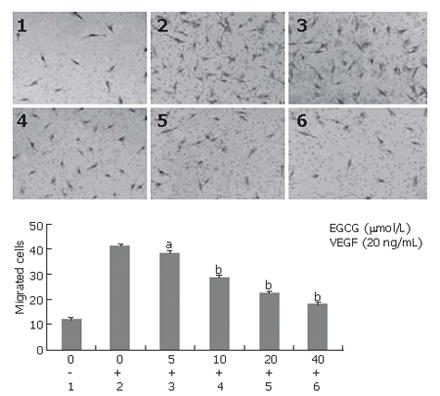
Figure 6 EGCG inhibits endothelial cell migration induced by VEGF.
EGCG inhibited migration of HUVECs induced by VEGF in a dose-dependent manner. Data are presented as mean ± SE (n = 3). VEGF-induced migration without EGCG treatment was used as a control. Values significantly lower than control are indicated (aP < 0.05, bP < 0.01).
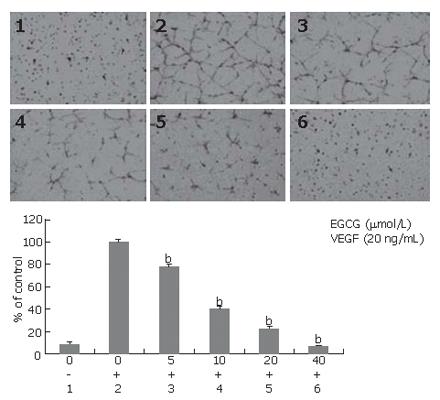
Figure 7 Inhibition of EGCG on VEGF-induced tube formation of endothelial cells.
EGCG dose-dependently inhibited tube formation induced by VEGF on Matrigel. Data are expressed as percent of control. VEGF-induced tube formation without EGCG treatment was used as a control. Values significantly lower than control are indicated (bP < 0.01).
- Citation: Zhu BH, Zhan WH, Li ZR, Wang Z, He YL, Peng JS, Cai SR, Ma JP, Zhang CH. (-)-Epigallocatechin-3-gallate inhibits growth of gastric cancer by reducing VEGF production and angiogenesis. World J Gastroenterol 2007; 13(8): 1162-1169
- URL: https://www.wjgnet.com/1007-9327/full/v13/i8/1162.htm
- DOI: https://dx.doi.org/10.3748/wjg.v13.i8.1162


