Copyright
©2007 Baishideng Publishing Group Co.
World J Gastroenterol. Feb 21, 2007; 13(7): 1042-1052
Published online Feb 21, 2007. doi: 10.3748/wjg.v13.i7.1042
Published online Feb 21, 2007. doi: 10.3748/wjg.v13.i7.1042
Figure 1 Ferritin takes up radiolabelled iron in a time dependent manner and has a direct role in iron absorption: Upper panel: Autoradiogram of duodenal proteins.
Duodenal mucosal proteins (100 μg) obtained after 15 min, 30 min, 1 h after an oral dose of 7-10 μCi of 59FeCl3 were subjected to 4%-20% PAGE and dehydrated. The radioactive bands were developed on X-ray film. As shown in the figure, one radioactive band corresponding to ferritin whose intensity was maximal at 30 min and then decreased with time. Lower panel: These proteins were subjected to western blot with ferritin antibody.
Figure 2 Reciprocal relationship between luminal transferrin and mucosal ferritin.
A: Luminal and mucosal proteins collected after oral administration of 59Fe after various time intervals were subjected to immunoprecipitation with ferritin and transferrin antibodies. The bar graph represents percentage incorporation of 59Fe in luminal transferrin (crossed bars) and mucosal ferritin (open bars) of duodenum; B: Percentage of ferritin bound iron out of total protein bound iron with time, in various iron status conditions.
Figure 3 Microautoradiography demonstrated the sequential transfer of iron: Microautoradiography of duodenal sections of intestine obtained after oral administration of 100 μCi of 59FeCl3 and 250 g of carrier iron in iron deficient top panel (ID), control middle panel (C) and iron overload bottom panel (OL) rats.
These photographs illustrate the progressive transfer of iron into the villi (25 x).
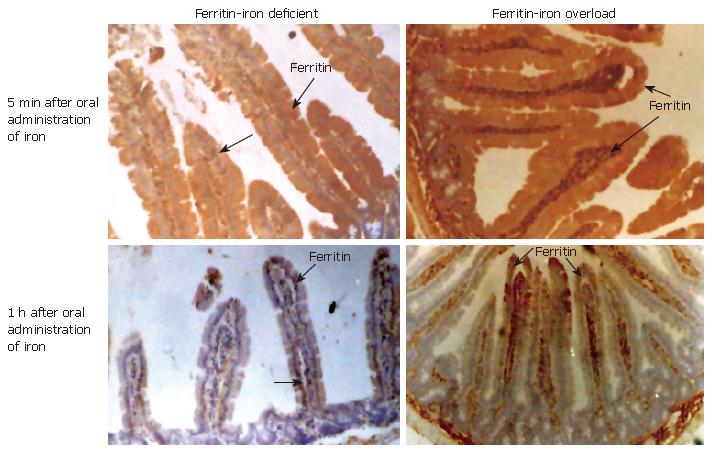
Figure 4 Ferritin appears in the epithelial cells after oral administration of 59Fe: Immunohistochemical localization of ferritin (Fe) in the duodenal sections of intestine of iron deficient left panel (ID) and iron overload right panel (OL) rats at various time points after oral administration of radioactive iron (25 X).
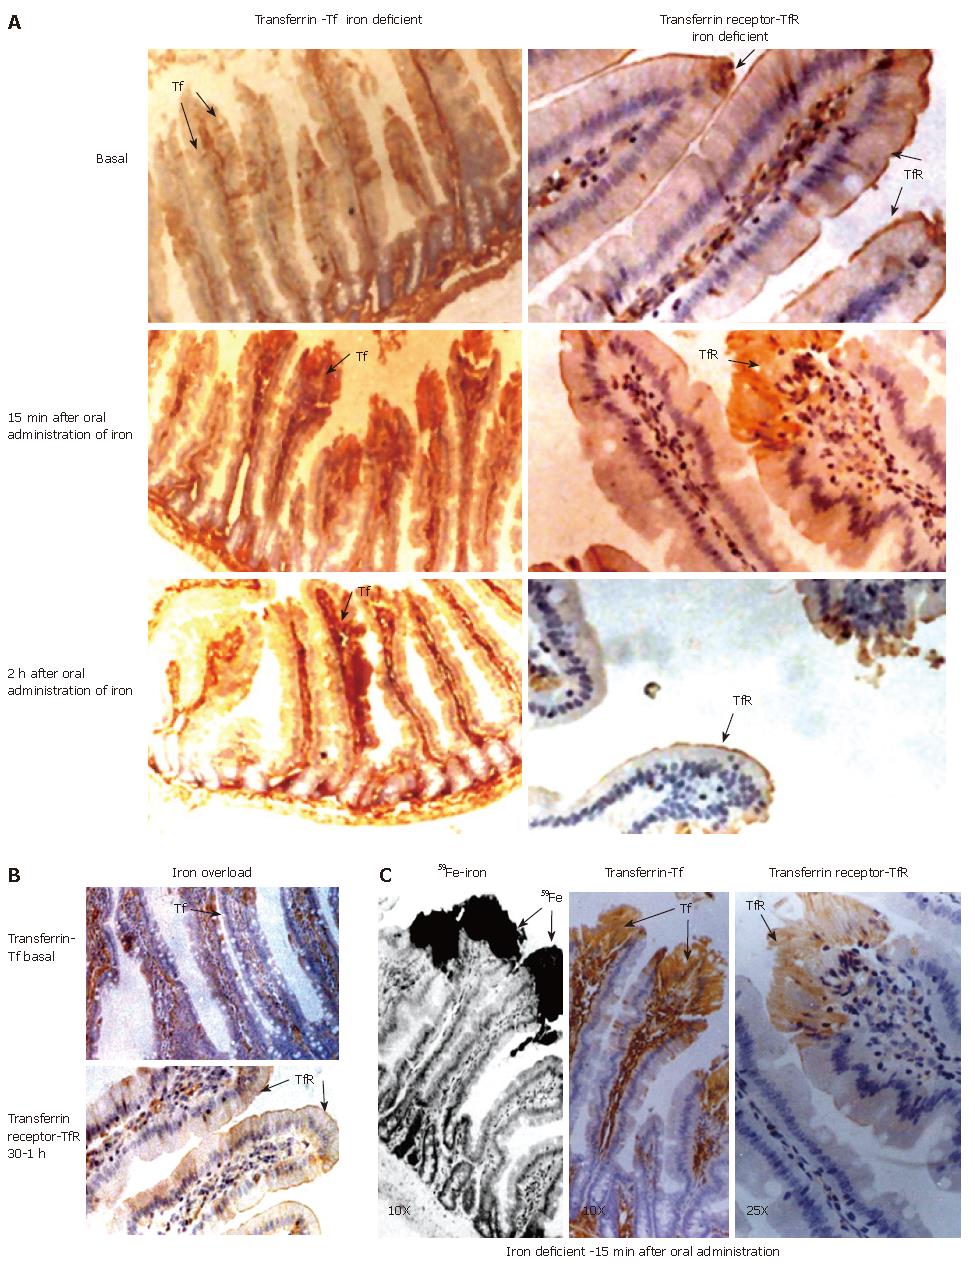
Figure 5 Microautoradiography and immunohistocheminstry with transferrin and transferrin receptor demonstrates the in vivo uptake of iron through transferrin receptor.
A: Immunohistochemical localization of transferrin left panel (Tf) and transferrin receptor right panel (TfR) in the duodenal sections of intestine of iron deficient rat (ID); B: transferrin stain in iron over loaded rat (top panel) (OL)at basal status and tranferrin receptor on the surface of the epithelial cells showing no internalization(bottom panel) in iron overloaded condition after oral administration of radioactive iron (10X); C: Co-localization of iron, transferrin and transferrin receptors in the duodenal sections of intestines of iron deficient rats obtained 15 min after oral administration of radioactive iron. Microautoradiographic localization of iron immunohistochemical localization of transferrin transferring receptor.
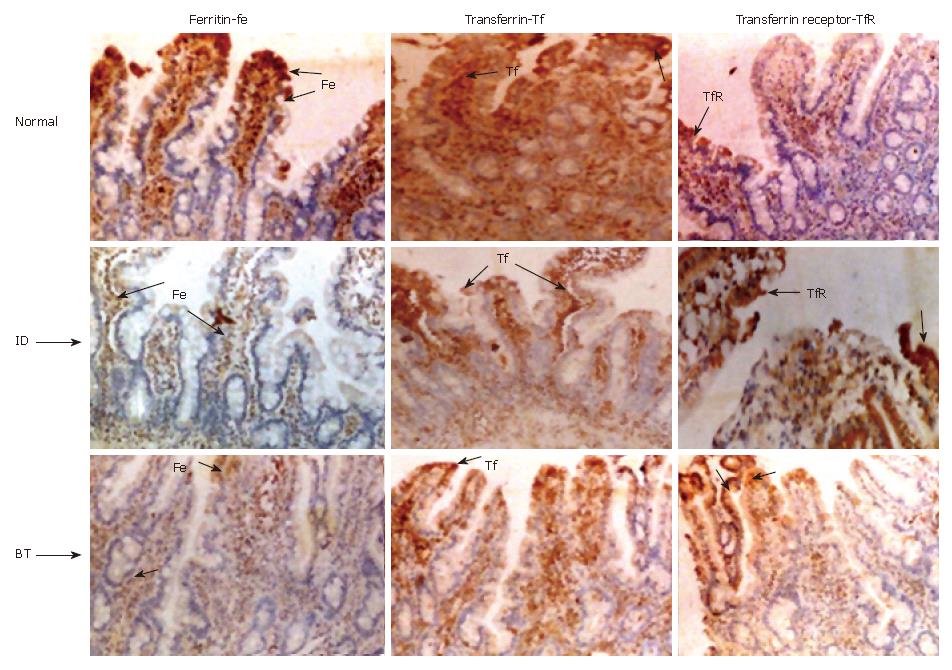
Figure 6 Staining intensity of ferritin, transferrin and transferrin receptor in human duodenal biopsy under different iron nutritional status: Immunohistochemical localization of ferritin (Fe), transferrin (Tf) and transferrin receptor (TfR) in the duodenal biopsy sections of normal (top panel, N), iron deficient (middle panel, ID) and blood transfused (bottom panel, BT) human subjects.
Staining intensity; ± represents Light, + normal, ++ good, +++ intense.
- Citation: Kolachala VL, Sesikeran B, Nair KM. Evidence for a sequential transfer of iron amongst ferritin, transferrin and transferrin receptor during duodenal absorption of iron in rat and human. World J Gastroenterol 2007; 13(7): 1042-1052
- URL: https://www.wjgnet.com/1007-9327/full/v13/i7/1042.htm
- DOI: https://dx.doi.org/10.3748/wjg.v13.i7.1042


