Copyright
©2007 Baishideng Publishing Group Inc.
World J Gastroenterol. Nov 7, 2007; 13(41): 5471-5475
Published online Nov 7, 2007. doi: 10.3748/wjg.v13.i41.5471
Published online Nov 7, 2007. doi: 10.3748/wjg.v13.i41.5471
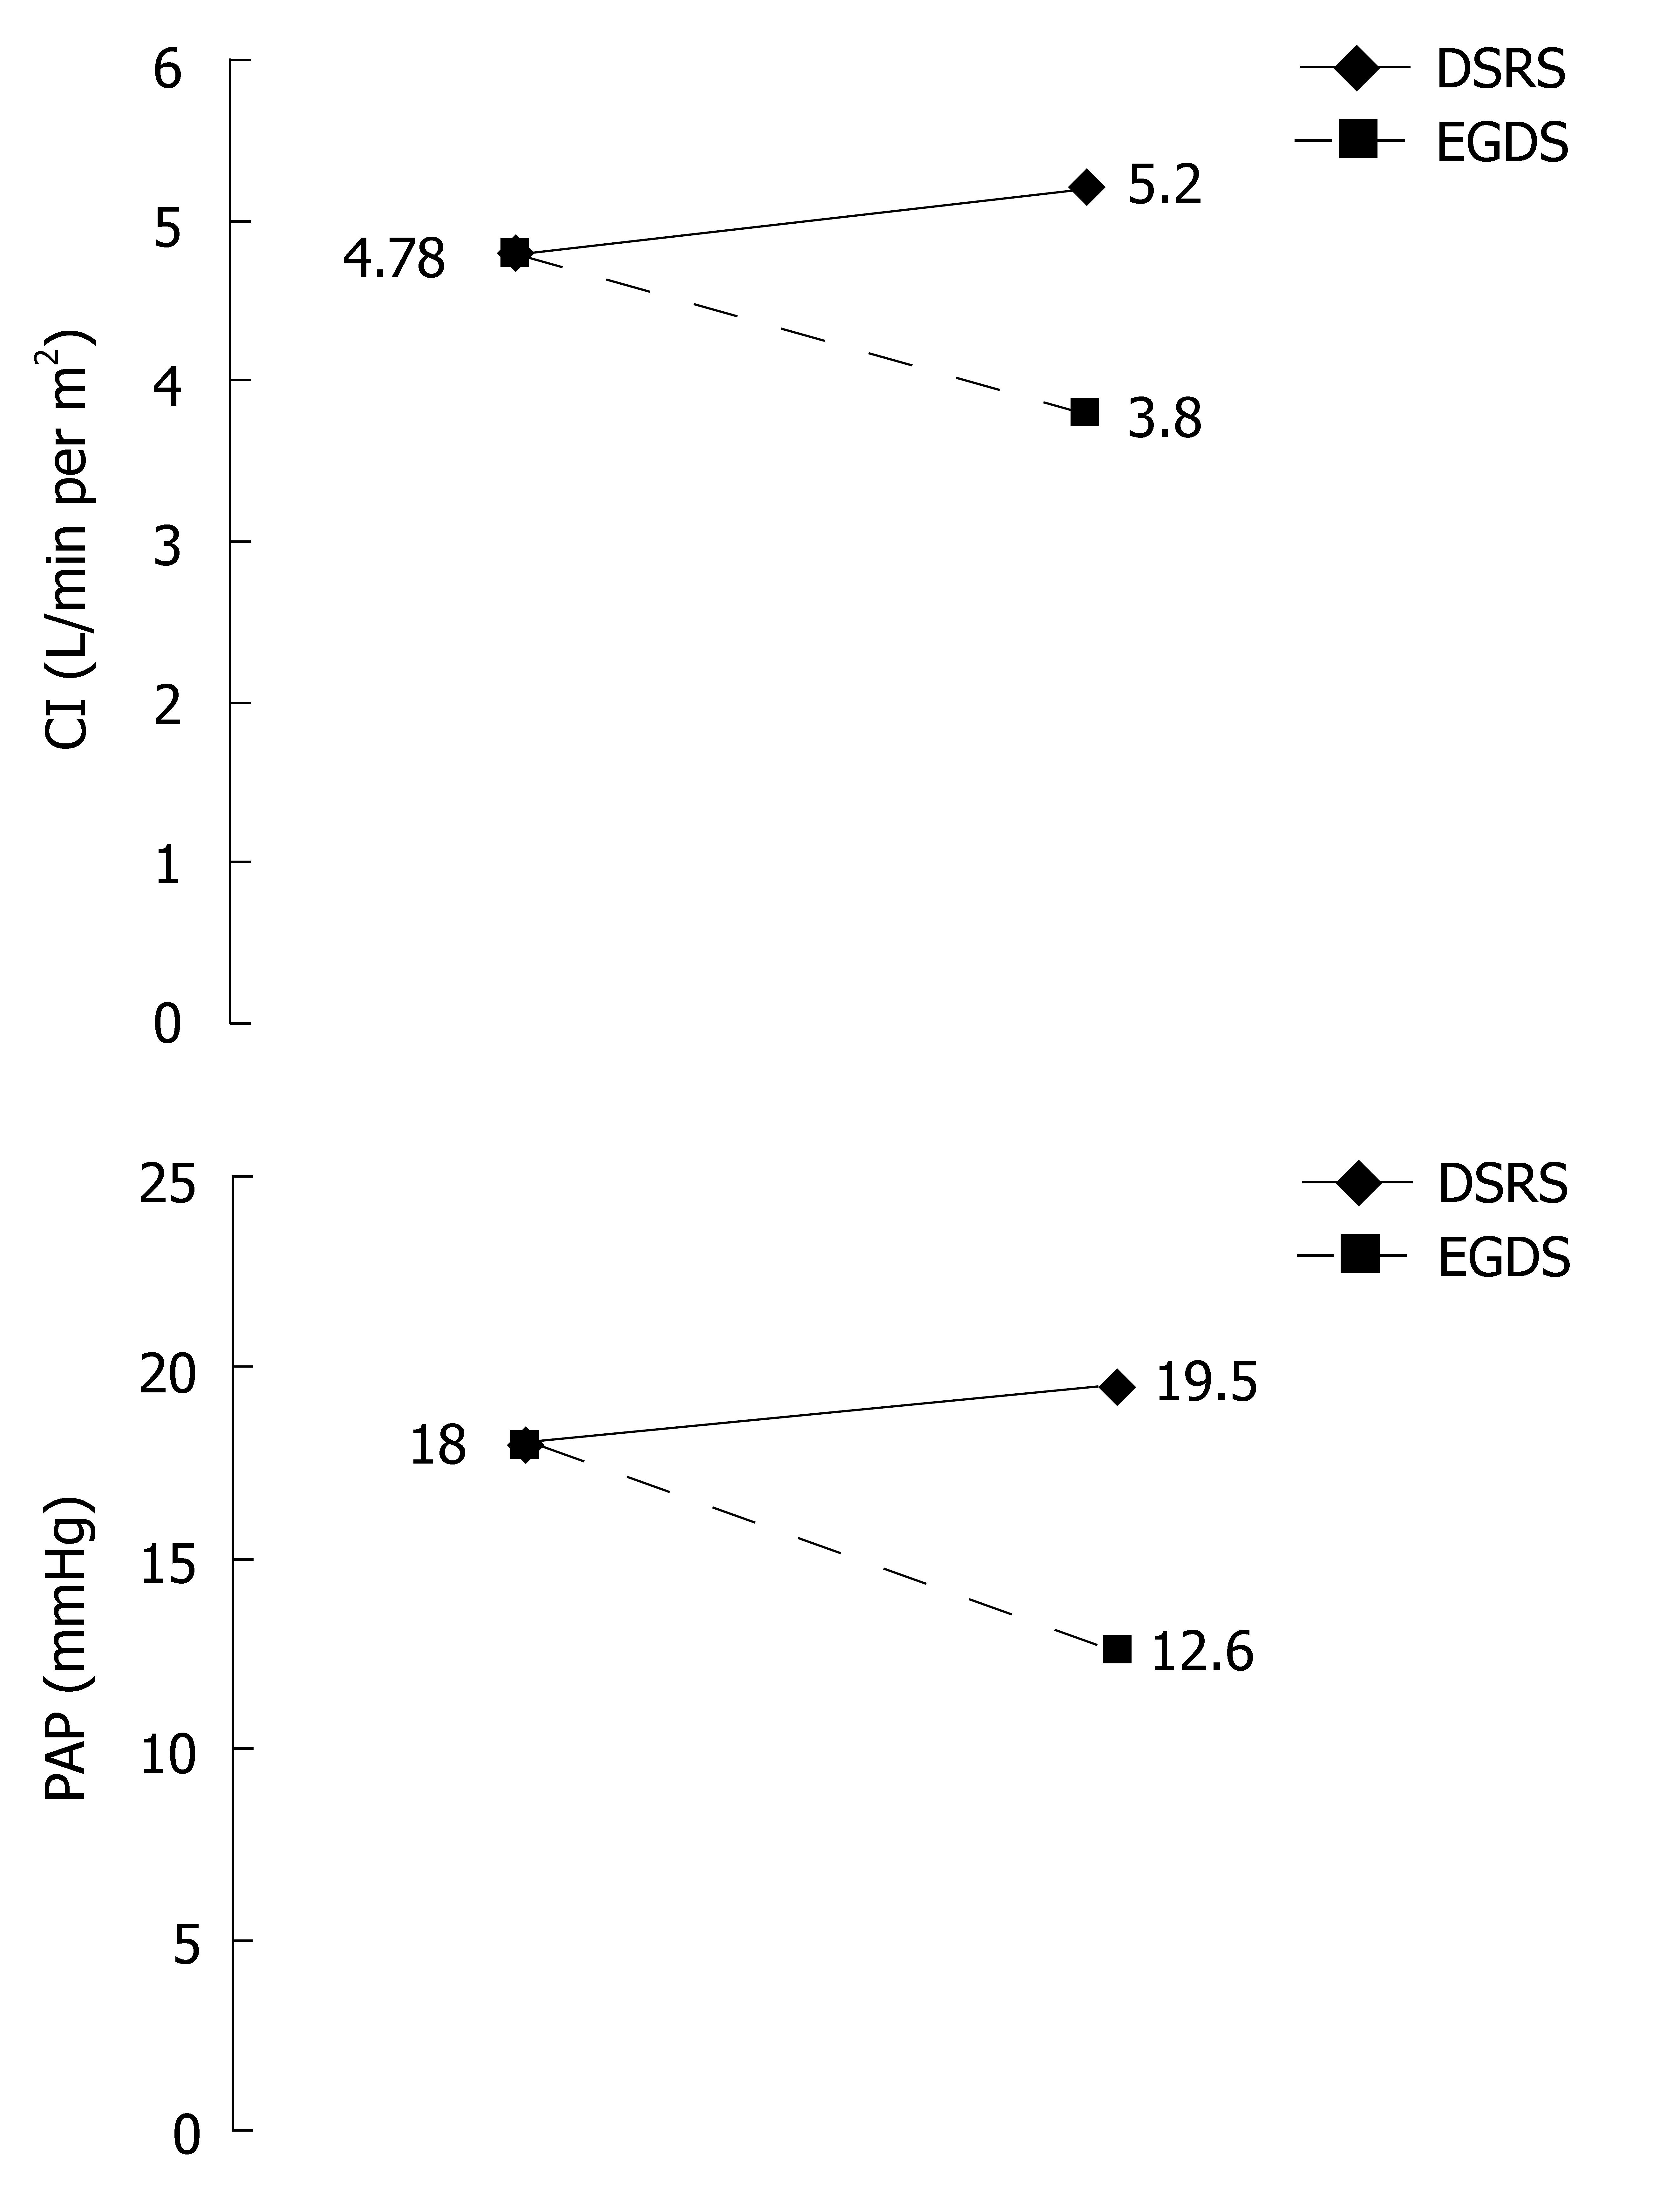
Figure 1 Schematic illustration showing important differences in cardiac index (CI) and pulmonary artery pressure (PAP) before and after EGDS (dashed line) and DSRS (continuous line).
- Citation: de Cleva R, Herman P, D'albuquerque LAC, Pugliese V, Santarem OL, Saad WA. Pre- and postoperative systemic hemodynamic evaluation in patients subjected to esophagogastric devascularization plus splenectomy and distal splenorenal shunt: A comparative study in schistomomal portal hypertension. World J Gastroenterol 2007; 13(41): 5471-5475
- URL: https://www.wjgnet.com/1007-9327/full/v13/i41/5471.htm
- DOI: https://dx.doi.org/10.3748/wjg.v13.i41.5471


