Copyright
©2007 Baishideng Publishing Group Co.
World J Gastroenterol. Aug 21, 2007; 13(31): 4214-4218
Published online Aug 21, 2007. doi: 10.3748/wjg.v13.i31.4214
Published online Aug 21, 2007. doi: 10.3748/wjg.v13.i31.4214
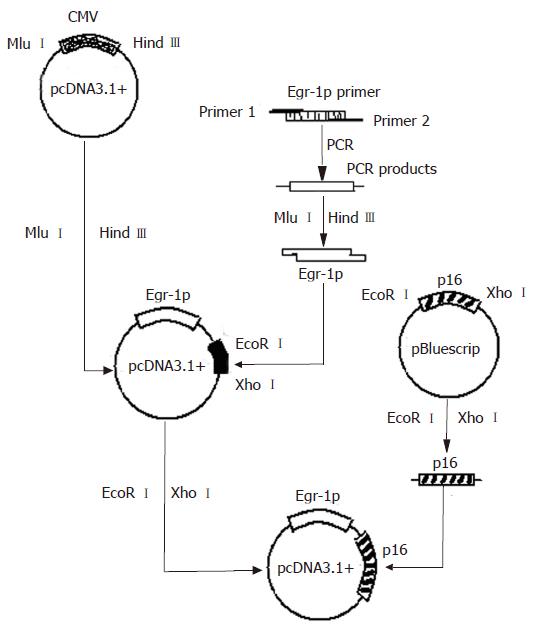
Figure 1 Diagram of plasmid pcDNA3.
1-Egr.1p-p16 construction.
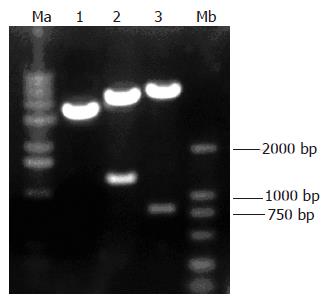
Figure 2 Electrophoresis patterns of the constructed vector digested with restriction endonucleases.
Ma: 1 kb marker; Lane 1: pcDNA3.1-Egr.1p-p16; lane 2: MluIand Hind III; lane 3: EcoRI and XhoI; Mb: DL2000 marker.
Figure 3 Expression of p16 in JF305 cells after X-irradiation.
Lane A: control group; lane B: 0 Gy group; lane C: 2 Gy group; lane D: 4 Gy group; lane E:8 Gy group; lane F: 10 Gy group; lane G: 20 Gy group.
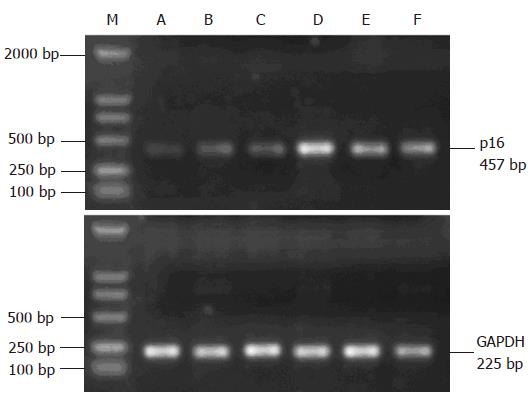
Figure 4 Transcription level of p16 mRNA after irradiation.
Lane M: DL2000 marker; lane A: 0 Gy group; lane B: 2 Gy group; lane C: 4 Gy group; lane D: 8 Gy group; lane E: 10 Gy group; lane F: 20 Gy group.
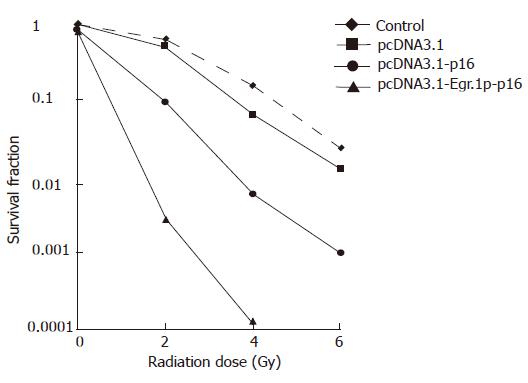
Figure 5 pcDNA3.
1-p16 and pcDNA3.1-Egr.1p-p16 transfection showing JF305 cell survival determined by clonogenic assay.
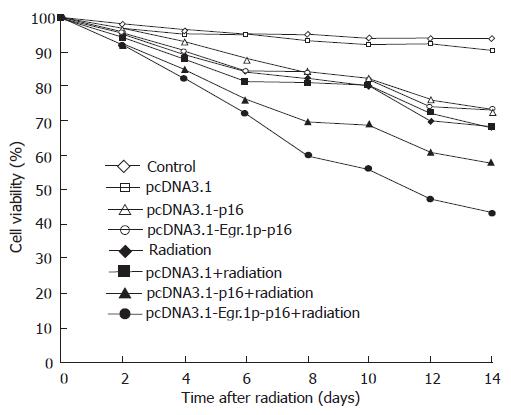
Figure 6 pcDNA3.
1-Egr-1p-p16 transfection showing JF305 cell viability determined by trypan blue exclusion.
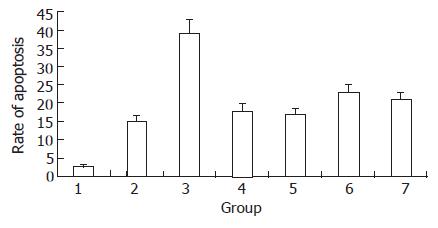
Figure 7 Apototic changes in transfected JF305 cells.
1: control group; 2: pcDNA3.1+ group; 3: 2 Gy irradiation group; 4: pcp16 group; 5: pcDNA3.1-Egr.1p-p16 group; 6: pc DNA3.1-p16+2 Gy irradiation group; 7: pcDNA3.1-Egr.1p-p16+2 Gy irradiation group.
-
Citation: Ma HB, Wang XJ, Di ZL, Xia H, Li Z, Liu J, Ma J, Kang HF, Wu CM, Bai MH. Construction of targeted plasmid vector pcDNA3.1-Egr.1p-p16 and its expression in pancreatic cancer JF305 cells induced by radiation
in vitro . World J Gastroenterol 2007; 13(31): 4214-4218 - URL: https://www.wjgnet.com/1007-9327/full/v13/i31/4214.htm
- DOI: https://dx.doi.org/10.3748/wjg.v13.i31.4214


