Copyright
©2007 Baishideng Publishing Group Co.
World J Gastroenterol. Aug 14, 2007; 13(30): 4072-4079
Published online Aug 14, 2007. doi: 10.3748/wjg.v13.i30.4072
Published online Aug 14, 2007. doi: 10.3748/wjg.v13.i30.4072
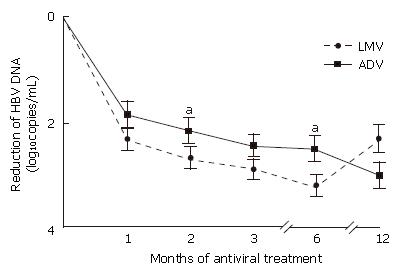
Figure 1 Mean log10 changes in serum hepatitis B virus (HBV) DNA levels after administration of lamivudine (dashed line) and adefovir (continuous line).
Mean (± SD) changes from baseline in serum HBV DNA concentrations were evaluated using real time PCR assays (lower limit of detection, 366 copies/mL). aP < 0.05. HBV: hepatitis B virus; LMV: lamivudine; ADV: adefovir dipivoxil.
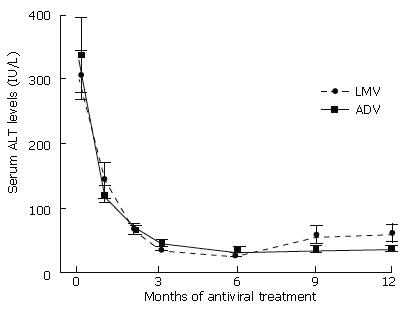
Figure 2 Mean changes in serum alanine aminotransferase levels after administration of lamivudine (dashed line) and adefovir (continuous line).
The levels were obtained at baseline and after 3, 6, 9 and 12 mo of lamivudine and adefovir treatment. The values are not significantly different (P > 0.05). ALT: alanine aminotransferase; LMV: lamivudine; ADV: adefovir dipivoxil.
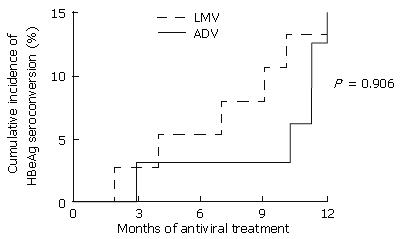
Figure 3 Cumulative rates of sustained hepatitis B e antigen (HBeAg) seroconversion during one year of treatment with lamivudine (dashed line) and after switching to adefovir (continuous line).
Only patients with positive HBeAg values at baseline were included in the analysis. Cumulative rates after one-year treatment of lamivudine and adefovir were 13% and 15%, respectively. LMV: lamivudine; ADV: adefovir dipivoxil; HBeAg: hepatitis B e antigen.
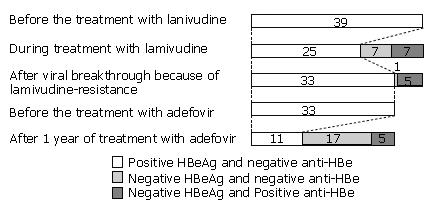
Figure 4 Changes in the status of hepatitis B e antigen (HBeAg) and anti-HBe after treatment with lamivudine and adefovir in patients with positive HBeAg.
Before treatment with lamivudine, HBeAg was positive in 39 patients. After one year of treatment, 7 patients became HBeAg negative and 2 of these became anti-HBe positive. During treatment with lamivudine, 14 patients became HBeAg negative and 7 of these became anti-HBe positive. After development of viral breakthrough because of lamivudine-resistance, HBeAg reappeared in 8 of the 14 patients. HBeAg was positive in 33 patients before the treatment with adefovir. HBeAg became negative in 22 patients and 5 of them became anti-HBe positive after one year of treatment. The numerals in the boxes represent the number of patients according to the status of HBeAg and anti-HBe.
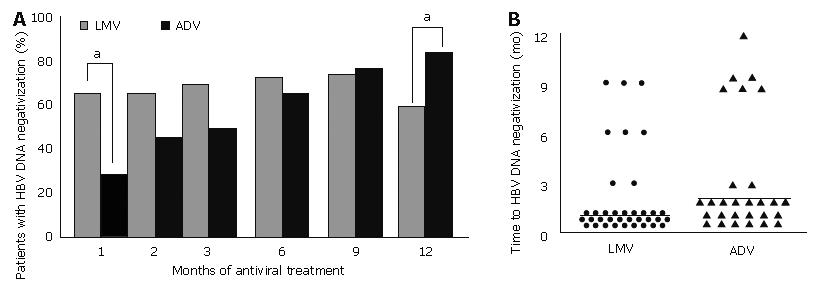
Figure 5 A: Percentage of patients with undectable HBV DNA (by hybridization assay) at months 1, 2, 3, 6, 9, and 12 after treatment with lamivudine (gray bars) and after switching to adefovir (black bars).
aP < 0.05 vs ADV; B: Time to HBV DNA loss during 12 mo of lamivudine (left) and adefovir (right) treatment. HBV DNA became negative in 36 patients with lamivudine and in 28 patients with adefovir. Note that HBV DNA negativization took about 1 mo longer with adefovir (median 2 mo) compared to lamivudine (median 1 mo; P < 0.05). Times to HBV DNA negativization (by hybridization assay) after lamivudine or adefovir treatment in each patient is represented as ● and ▲, respectively. Horizontal bars (—) represent median time to HBV DNA negativization. LMV: lamivudine; ADV: adefovir dipivoxil.
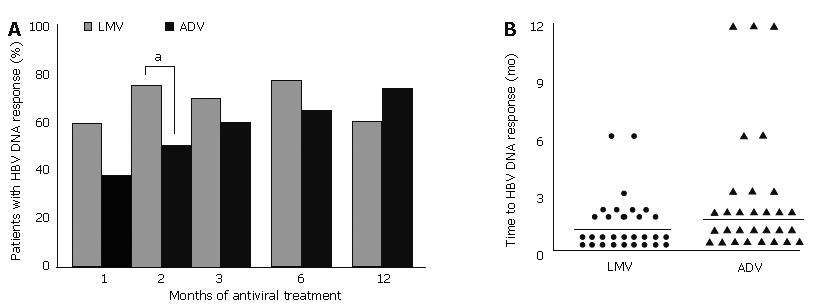
Figure 6 A: Percentage of patients with HBV DNA responses at months 1, 2, 3, 6, 9, and 12 after treatment with lamivudine (gray bars) and adefovir (black bars).
aP < 0.05 vs ADV; B: Time to HBV DNA response during 12 mo of lamivudine (left) and adefovir (right) treatments. HBV DNA responses appeared in 36 patients with lamivudine treatment and in 30 patients with adefovir treatment. HBV DNA response was slower when patients were treated with adefovir (median 1.5 mo) than with lamivudine (median 1 mo; P < 0.05). Time to HBV DNA response after lamivudine or adefovir treatment in each patient is shown as ● and ▲, respectively. Horizontal bars (—) represent median times to HBV DNA response. LMV: lamivudine; ADV: adefovir dipivoxil.
- Citation: Seo YS, Kim JH, Yeon JE, Park JJ, Kim JS, Byun KS, Bak YT, Lee CH. Antiviral efficacy of adefovir dipivoxil versus lamivudine in patients with chronic hepatitis B sequentially treated with lamivudine and adefovir due to lamivudine resistance. World J Gastroenterol 2007; 13(30): 4072-4079
- URL: https://www.wjgnet.com/1007-9327/full/v13/i30/4072.htm
- DOI: https://dx.doi.org/10.3748/wjg.v13.i30.4072


