Copyright
©2007 Baishideng Publishing Group Co.
World J Gastroenterol. Jan 21, 2007; 13(3): 462-466
Published online Jan 21, 2007. doi: 10.3748/wjg.v13.i3.462
Published online Jan 21, 2007. doi: 10.3748/wjg.v13.i3.462
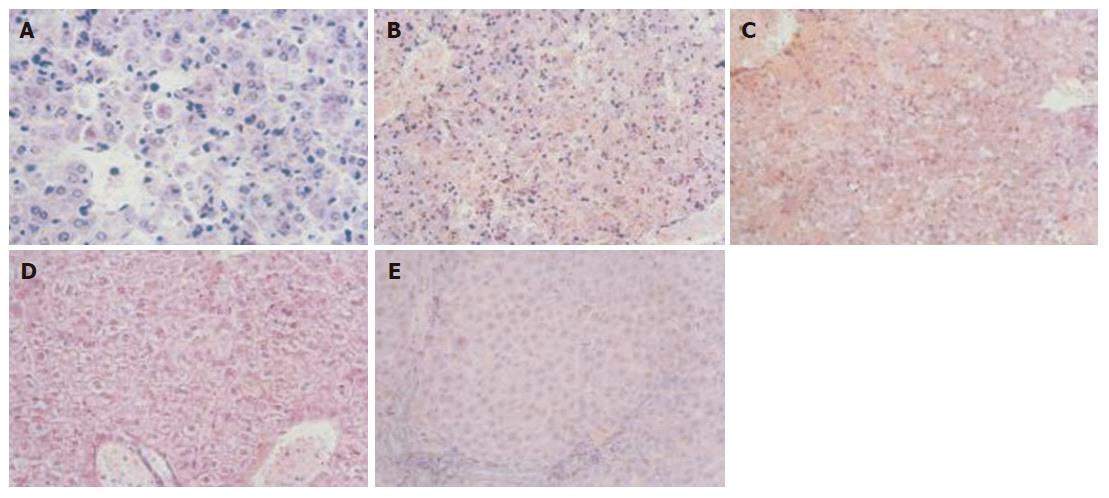
Figure 1 Optical microscopy showing liver cell apoptosis and necrosis (A) and liver cell necrosis (B) 24 h (C), 36 h (D), 72 h (E) after given SNMC (HE, × 20).
Figure 2 Electron microscopy showing results in model group (A) (× 6000), 3 d (B) (× 10 000) and 7 d (C) after given SNMC (× 6000).
- Citation: Yang BS, Ma YJ, Wang Y, Chen LY, Bi MR, Yan BZ, Bai L, Zhou H, Wang FX. Protective effect and mechanism of stronger neo-minophagen C against fulminant hepatic failure. World J Gastroenterol 2007; 13(3): 462-466
- URL: https://www.wjgnet.com/1007-9327/full/v13/i3/462.htm
- DOI: https://dx.doi.org/10.3748/wjg.v13.i3.462


