Copyright
©2007 Baishideng Publishing Group Inc.
World J Gastroenterol. Jul 14, 2007; 13(26): 3581-3591
Published online Jul 14, 2007. doi: 10.3748/wjg.v13.i26.3581
Published online Jul 14, 2007. doi: 10.3748/wjg.v13.i26.3581
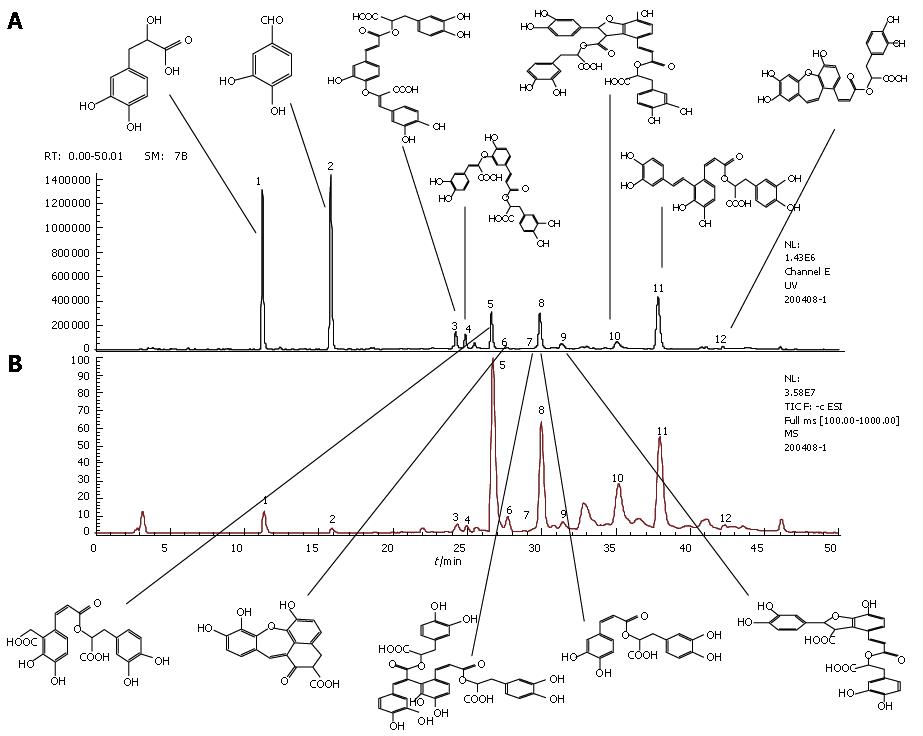
Figure 1 LC-MS chroma-tograms of compound Danshen injection sample (A) and MS total ion current chromatograms of compound Danshen injection sample (B).
The common peaks in panel A represent Danshensu (peak 1), protocatechu aldehyde (peak 2), salvianolic acid I or H (peak 3), salvianolic acid I or H (peak 4), salvianolic acid D (peak 5), salvianolic acid G (peak 6), salvianolic acid E (peak 7), rosmarinic acid (peak 8), lithospermic acid (peak 9), salvianolic acid B (peak 10), salvianolic acid A (peak 11) and isosalvianolic acid C (peak 12).
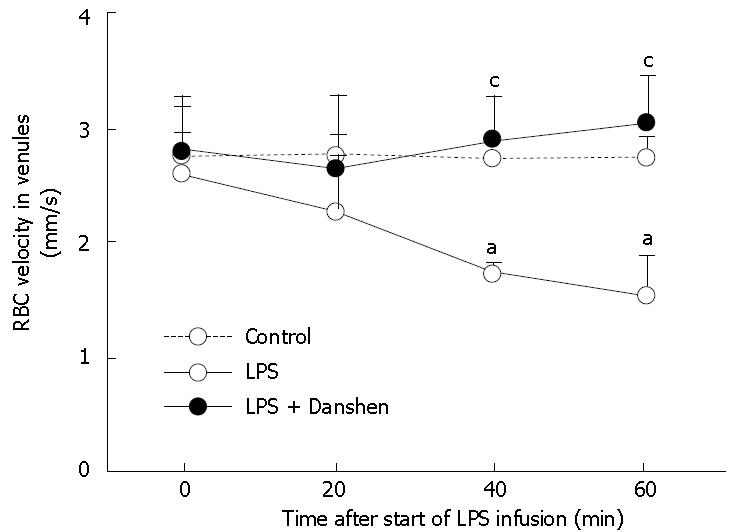
Figure 2 Time course of changes in velocity of RBCs in venules in different groups.
Control: Control group; LPS: LPS group; LPS + Danshen: LPS plus compound Danshen injection group. Data are mean ± SD from 6 rats. aP < 0.05 vs 0 min; cP < 0.05 vs LPS group.
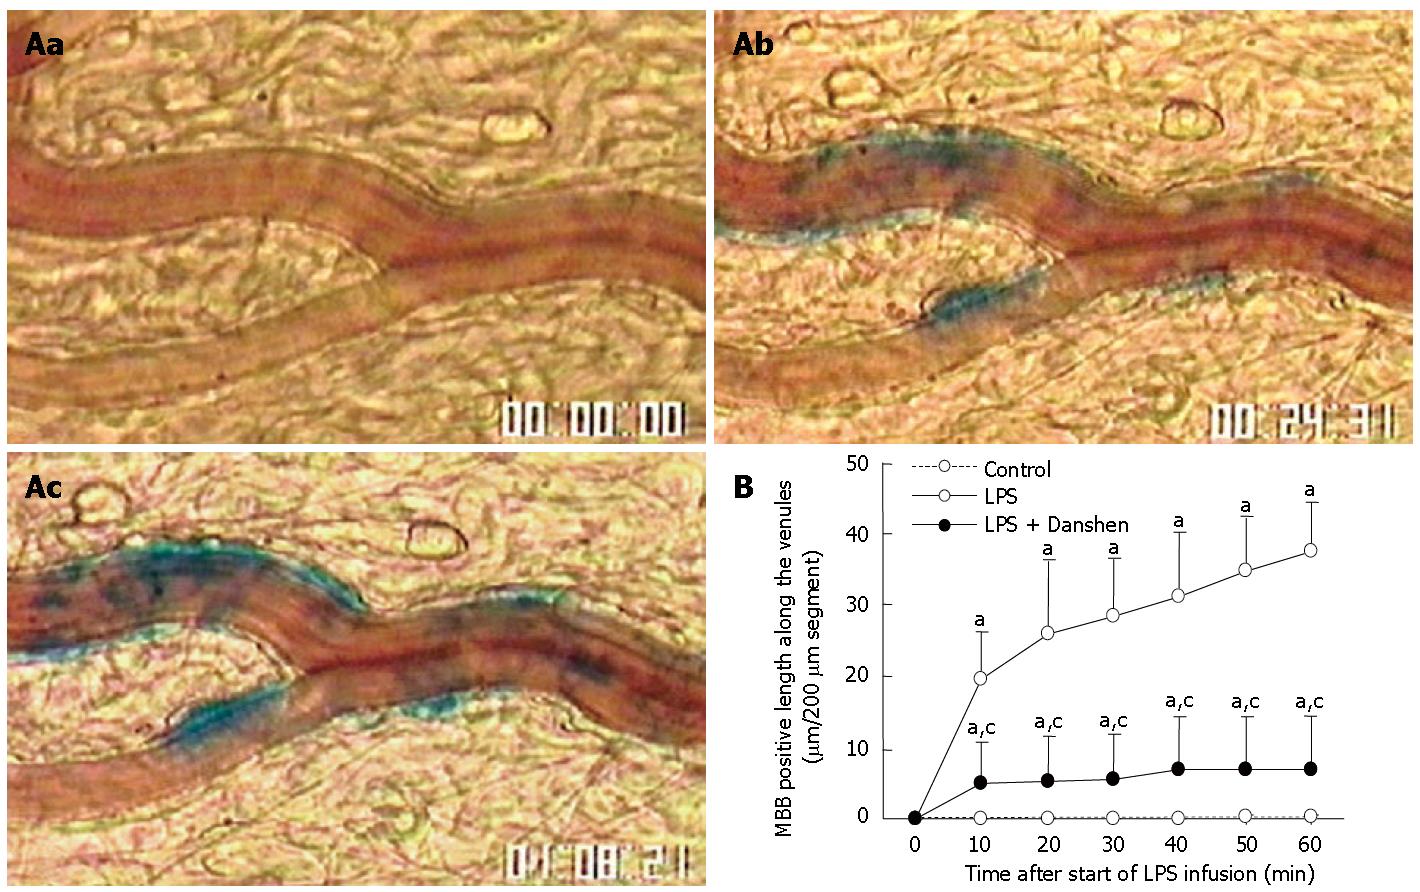
Figure 3 Location of MBB staining of venular wall after LPS infusion (A).
a: before LPS infusion; b: 20 min after LPS infusion; c: 60 min after LPS infusion. Numerous MBB staining areas in venular wall were observed in b and c. Bar: 50 μm. Time course of changes in the length of venular wall stained with MBB in different groups. Control: control group; LPS: LPS group; LPS + Danshen: LPS plus compound Danshen injection group. Data are mean ± SD from 6 rats (B). aP < 0.05 vs 0 min; cP < 0.05 vs LPS group.
Figure 4 Time course of changes in the number of rolling leukocytes along venular wall (A) and leukocytes adherent to venular wall (B) in different groups.
The number of rolling leukocytes or leukocytes adherent was expressed as the number of cells per 200 μm of venules. Control: Control group; LPS: LPS group; LPS + Danshen: LPS plus compound Danshen injection group. Data are mean ± SD from 6 rats. aP < 0.05 vs 0 min.
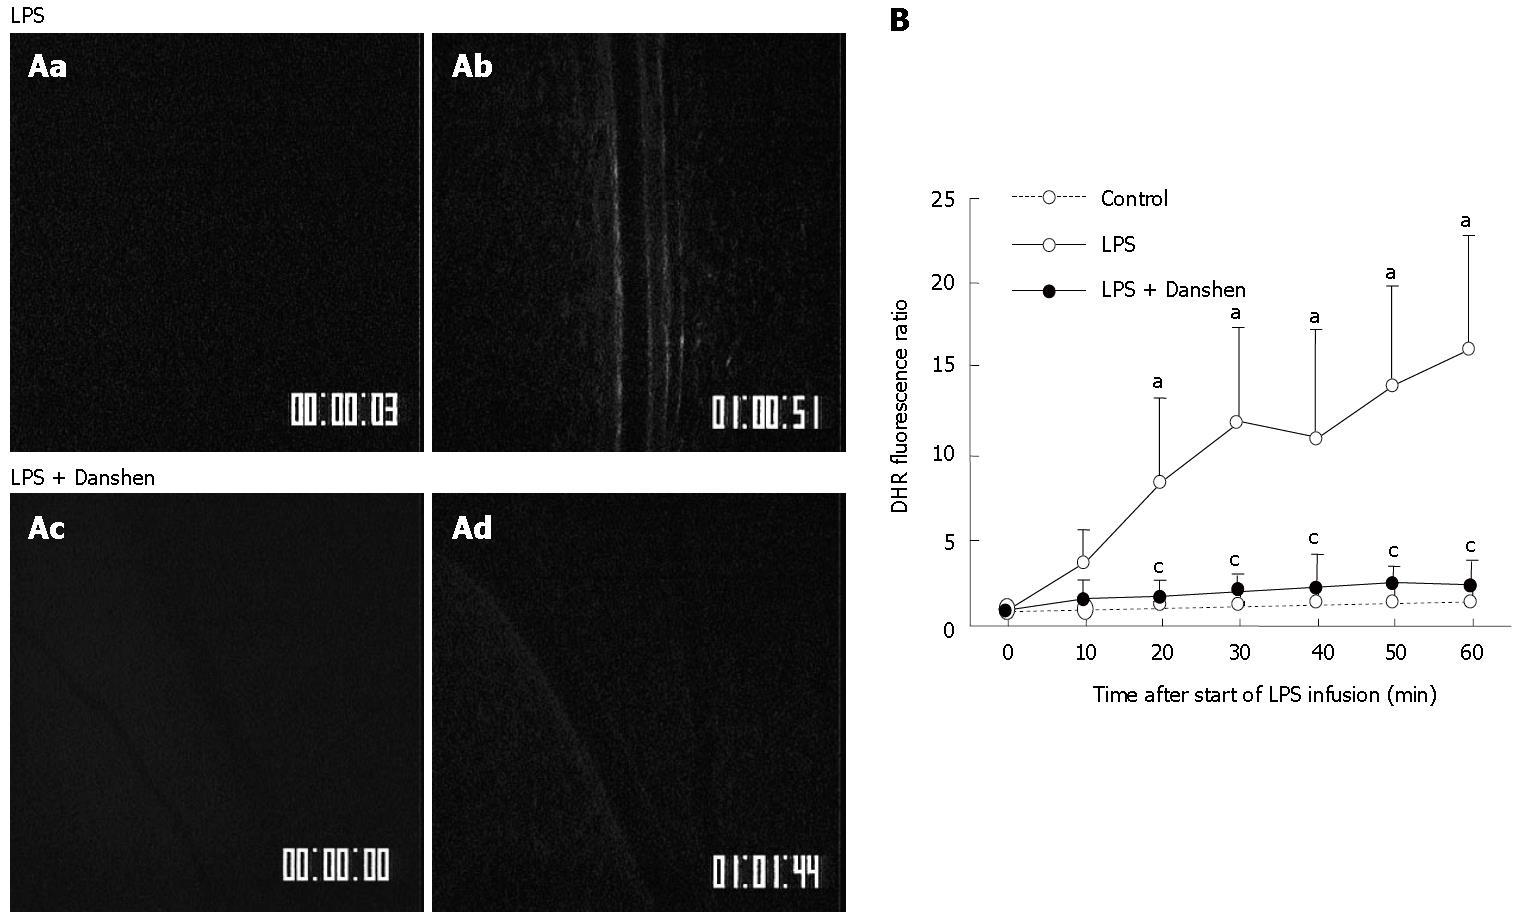
Figure 5 A: Representative images of the changes in fluorescence intensity of the H2O2-sensitive probe DHR in the rat mesentery venular wall of LPS group (top) and LPS plus compound Danshen injection group (bottom) at 0 min (a and c) and 60 min (b and d) after LPS infusion.
The DHR fluorescence on the venular wall was diminished by treatment with compound Danshen injection at 60 min (d) after LPS infusion; B: Time course of changes in DHR fluorescence ratio on the venular walls in different groups. Control: Control group; LPS: LPS group; LPS + Danshen: LPS plus compound Danshen injection group. Data are mean ± SD from 6 rats. aP < 0.05 vs 0 min; cP < 0.05 vs LPS group.
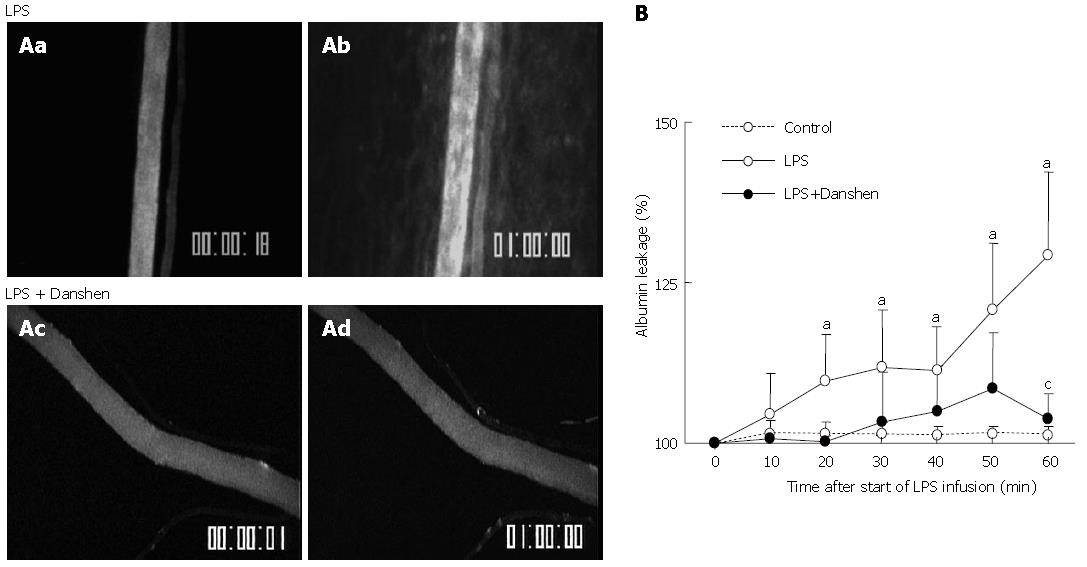
Figure 6 A: Representative fluorescence images of albumin leakage in rat mesentery venule of LPS group (top) and LPS plus compound Danshen injection group (bottom) at 0 min (a and c) and 60 min (b and d) after LPS infusion.
No detectable albumin leakage was found before LPS infusion (a and c). The albumin leakage from venule was observed after 60 min of LPS stimulation (b).This LPS-elicited albumin leakage was blunted by the treatment with compound Danshen injection (d); B: Time course of changes in albumin leakage from venules in different groups. Control: Control group; LPS: LPS group; LPS + Danshen: LPS plus compound Danshen injection group. Data are mean ± SD from 6 rats. aP < 0.05 vs 0 min; cP < 0.05 vs LPS group.
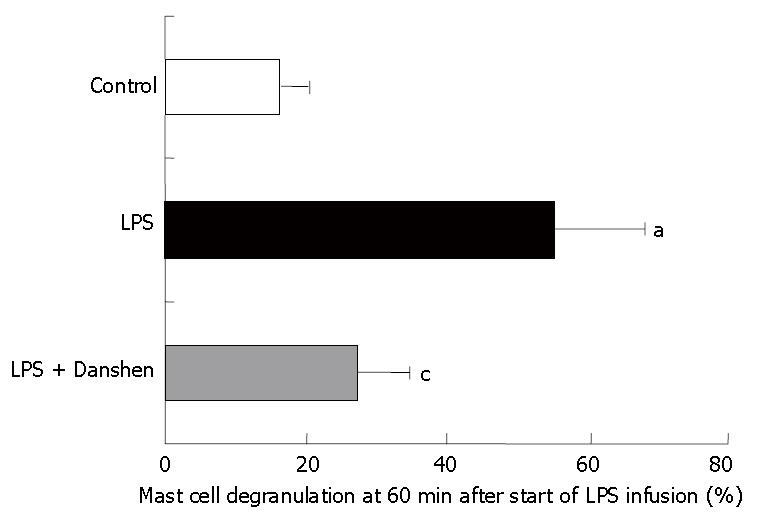
Figure 7 Quantitative evaluation of mast cell degranulation along venules in control group, LPS group and LPS plus compound Danshen injection group at 60 min after saline or LPS infusion.
Control: Control group; LPS: LPS group; LPS + Danshen: LPS + compound Danshen injection group. Data are mean ± SD from 6 rats. aP < 0.05 vs control group; cP < 0.05 vs LPS group.
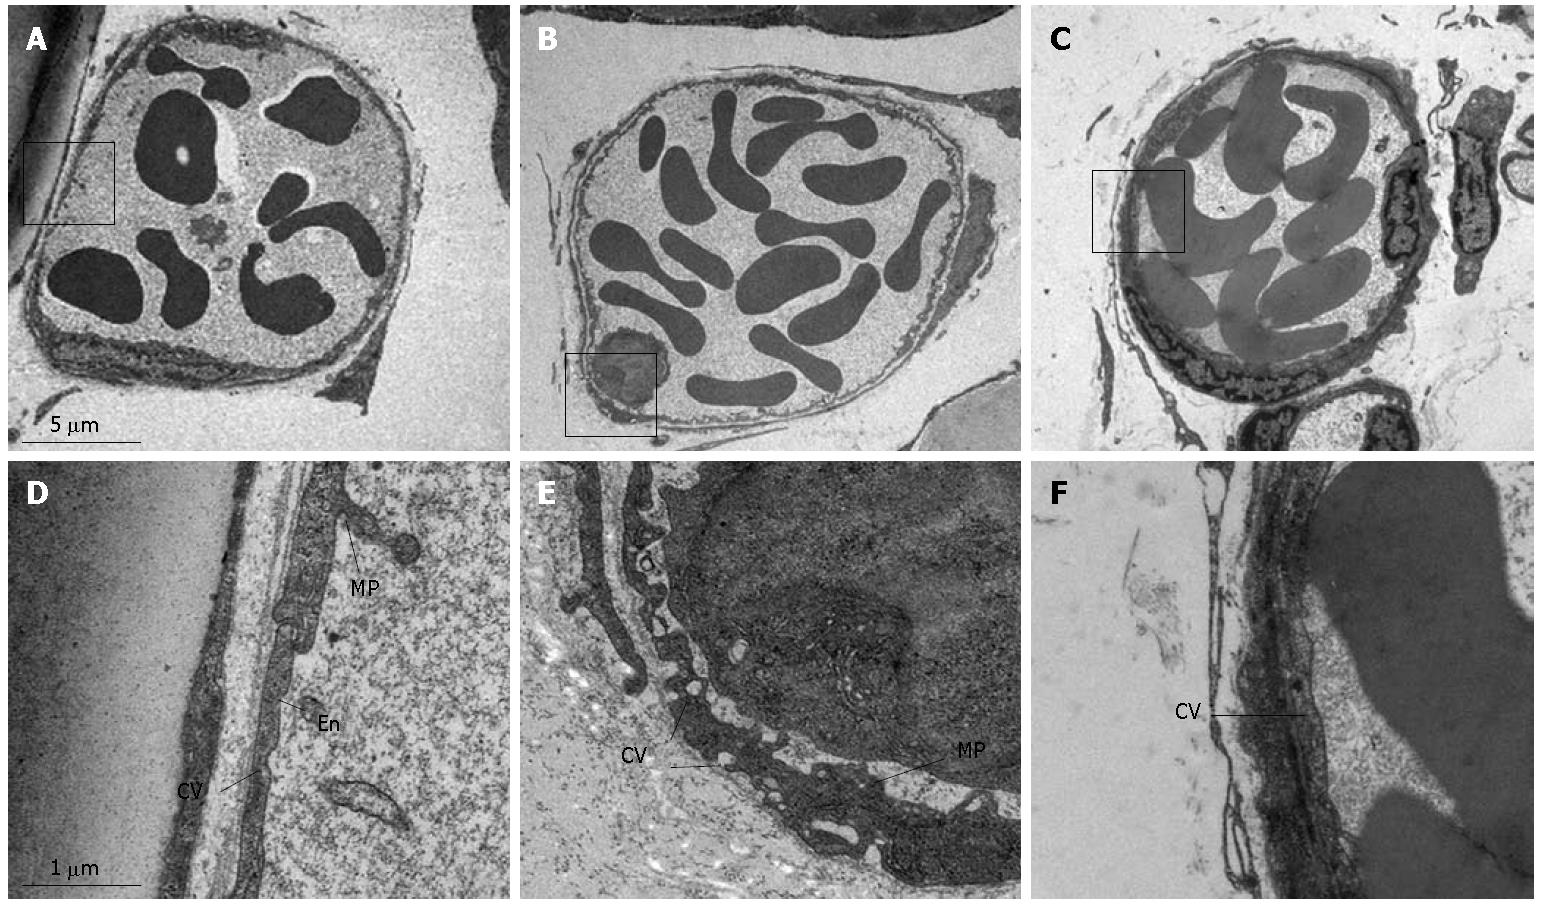
Figure 8 Representative electron micrographs of post-capillary venules of rat mesentery in the control group (A and D), LPS infusion group (B and E) and LPS plus compound Danshen injection group (C and F).
En: Endothelial cell; MP: Microprojection; CV: Cytoplasmic vesicle; L: Leukocyte. Magnification: A: 4000 x; B: 4000 x; C: 4000 x; D: 24 000 x; E: 24000 x; F: 24 000 x.
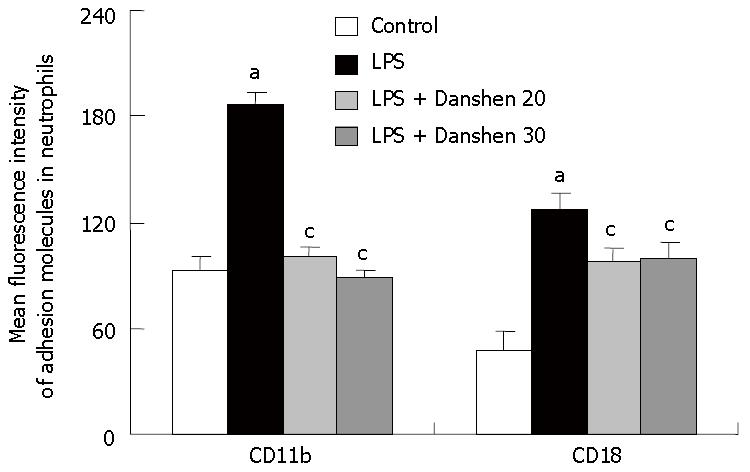
Figure 9 Fluorescence intensity of adhesion molecules CD11b and CD18 on neutrophils in different groups.
Control: control group; LPS: LPS group; LPS + Danshen 20: LPS plus compound Danshen injection (20 μL/mL) group; LPS + Danshen 30: LPS plus compound Danshen injection (30 μL/mL) group. Data are mean ± SD from 6 rats. aP < 0.05 vs control group; cP < 0.05 vs LPS group.
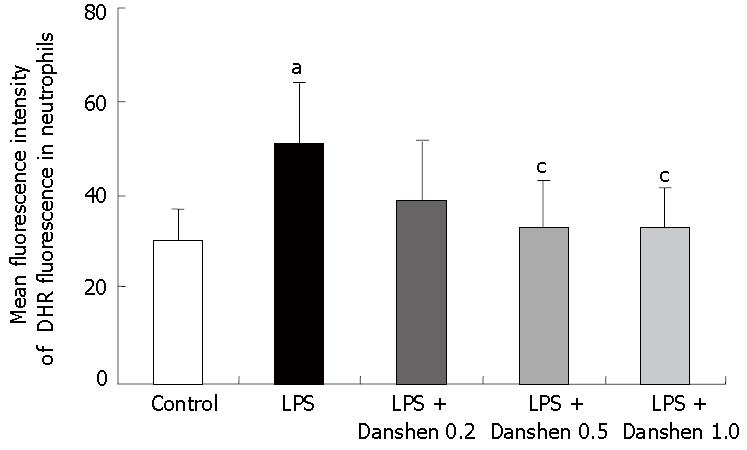
Figure 10 Intensity of DHR fluorescence on neutrophils in different groups.
Control: Control group; LPS: LPS group; LPS + Danshen 0.2: LPS plus compound Danshen injection (0.2 μL/mL) group; LPS + Danshen 0.5: LPS plus compound Danshen injection (0.5 μL/mL) group; LPS + Danshen 1.0: LPS plus compound Danshen injection (1.0 μL/mL) group. Data are mean ± SD from 6 rats. aP < 0.05 vs control group; cP < 0.05 vs LPS group.
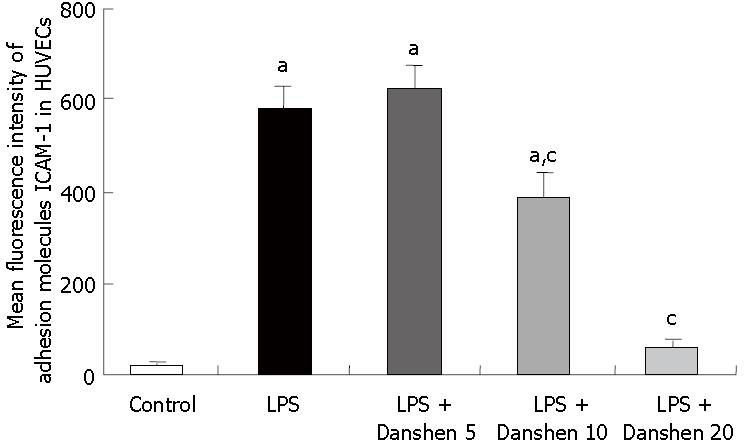
Figure 11 Fluorescence intensity of adhesion molecules ICAM-1 on HUVECs in different groups.
Control: Control group; LPS: LPS group; LPS + Danshen 5: LPS plus compound Danshen injection (5 μL/mL) group; LPS + Danshen 10: LPS plus compound Danshen injection (10 μL/mL) group; LPS + Danshen 20: LPS plus compound Danshen injection (20 μL/mL) group. Data are mean ± SD from 3 rats. aP < 0.05 vs control group; cP < 0.05 vs LPS group.
- Citation: Han JY, Horie Y, Miura S, Akiba Y, Guo J, Li D, Fan JY, Liu YY, Hu BH, An LH, Chang X, Xu M, Guo DA, Sun K, Yang JY, Fang SP, Xian MJ, Kizaki M, Nagata H, Hibi T. Compound Danshen injection improves endotoxin-induced microcirculatory disturbance in rat mesentery. World J Gastroenterol 2007; 13(26): 3581-3591
- URL: https://www.wjgnet.com/1007-9327/full/v13/i26/3581.htm
- DOI: https://dx.doi.org/10.3748/wjg.v13.i26.3581


