Copyright
©2007 Baishideng Publishing Group Inc.
World J Gastroenterol. Jul 14, 2007; 13(26): 3581-3591
Published online Jul 14, 2007. doi: 10.3748/wjg.v13.i26.3581
Published online Jul 14, 2007. doi: 10.3748/wjg.v13.i26.3581
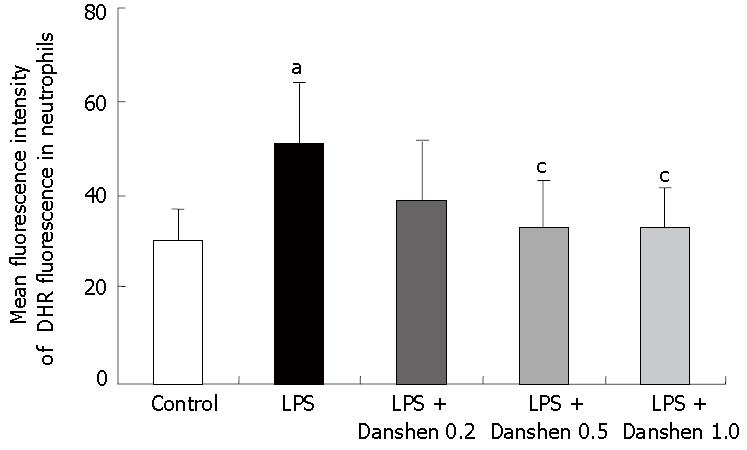
Figure 10 Intensity of DHR fluorescence on neutrophils in different groups.
Control: Control group; LPS: LPS group; LPS + Danshen 0.2: LPS plus compound Danshen injection (0.2 μL/mL) group; LPS + Danshen 0.5: LPS plus compound Danshen injection (0.5 μL/mL) group; LPS + Danshen 1.0: LPS plus compound Danshen injection (1.0 μL/mL) group. Data are mean ± SD from 6 rats. aP < 0.05 vs control group; cP < 0.05 vs LPS group.
- Citation: Han JY, Horie Y, Miura S, Akiba Y, Guo J, Li D, Fan JY, Liu YY, Hu BH, An LH, Chang X, Xu M, Guo DA, Sun K, Yang JY, Fang SP, Xian MJ, Kizaki M, Nagata H, Hibi T. Compound Danshen injection improves endotoxin-induced microcirculatory disturbance in rat mesentery. World J Gastroenterol 2007; 13(26): 3581-3591
- URL: https://www.wjgnet.com/1007-9327/full/v13/i26/3581.htm
- DOI: https://dx.doi.org/10.3748/wjg.v13.i26.3581


