Copyright
©2007 Baishideng Publishing Group Inc.
World J Gastroenterol. Jul 7, 2007; 13(25): 3478-3486
Published online Jul 7, 2007. doi: 10.3748/wjg.v13.i25.3478
Published online Jul 7, 2007. doi: 10.3748/wjg.v13.i25.3478
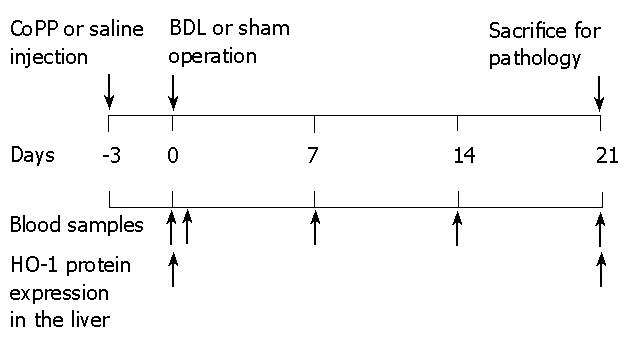
Figure 1 Experimental design.
Either CoPP or saline were injected intraperitoneally in male rats. Three days later, bile duct ligation (BDL) or sham operation was performed. Some animals were killed 3 d after CoPP injection or 3 wk after BDL to assess HO-1 protein expression in liver tissue. Blood samples were taken just before and at 0, 1, 7, 14, and 21 d after BDL to assess for alanine transaminase (ALT), aspartate aminotransaminase (AST), serum alkaline phosphatase (ALP), and bilirubin. Liver sections were taken from rats 3 wk after BDL to evaluate pathological changes.
Figure 2 Immunodetection of HO-1 in liver tissues 3 wk after BDL or sham operation.
The expression of HO-1 using an anti-HO-1 polyclonal antibody was determined by Western blot. Data are representative of 4 to 6 animals per group.
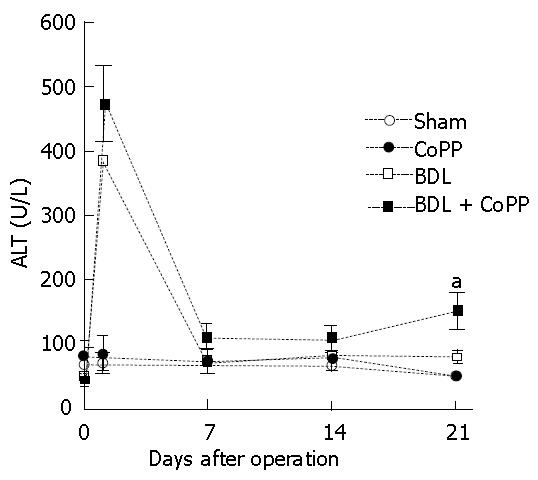
Figure 3 Time course of alanine transaminase (ALT) release after BDL or sham operation.
BDL or sham operation were performed 3 d after CoPP or saline injection, and blood samples were collected at time points indicated in the figure. Serum ALT activity was determined using commercial kits from Sigma. Values are means ± SD (n = 5-6 in each group). aP < 0.05 vs bile duct-ligated group receiving saline.
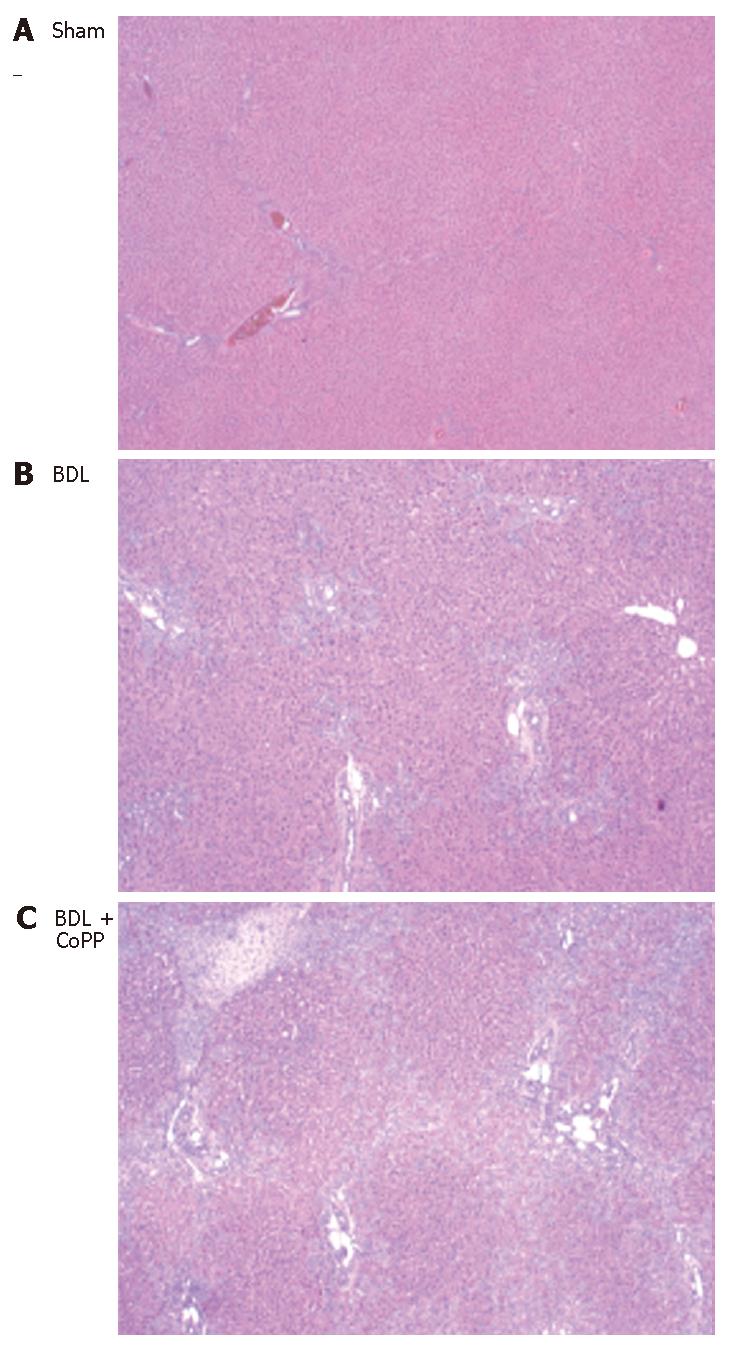
Figure 4 Effects of HO-1 overexpression on hepatic pathology changes caused by BDL.
Rats were pretreated with CoPP or saline. Livers were harvested 3 wk after BDL, and hematoxylin and eosin staining was performed to evaluate pathological changes. Shown are representative images (x 40). A: sham operation with saline pretreatment; B: BDL with saline pretreatment; C: BDL with CoPP pretreatment.
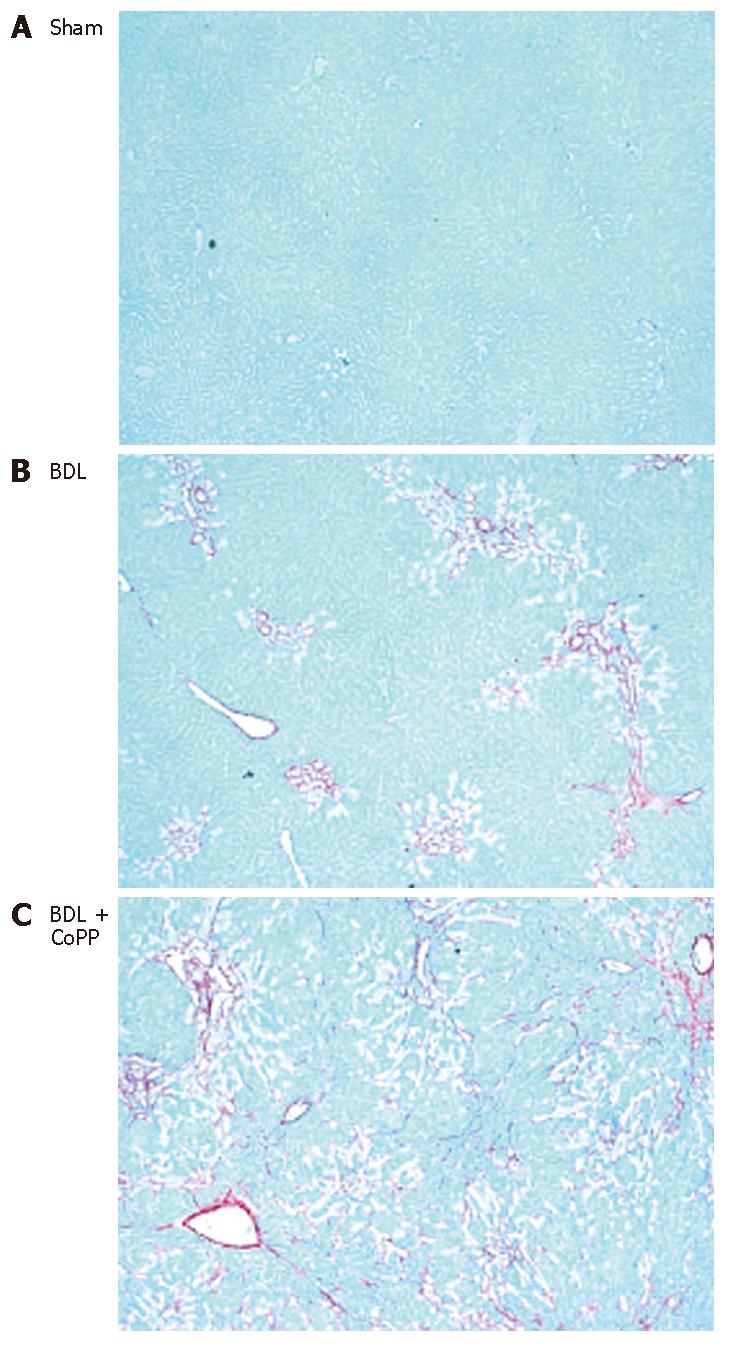
Figure 5 Effects of HO-1 overexpression on hepatic fibrosis after BDL.
Rats were pretreated with CoPP or saline. Livers were harvested 3 wk after BDL, and Sirius red staining of sections was performed. Shown are representative images (x 40). A: sham operation with saline pretreatment; B: BDL with saline pretreatment; C: BDL with CoPP pretreatment.
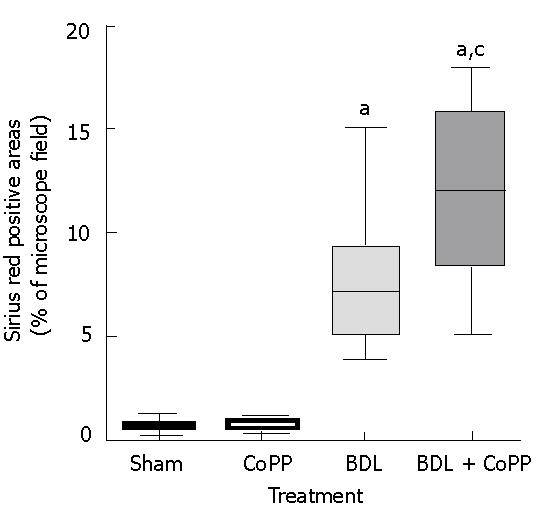
Figure 6 Quantification of hepatic fibrosis after BDL.
Liver sections were stained with Sirius red, as described in Figure 4. Five microscope fields (x 40 objective) were selected randomly, and fractional areas that were Sirius red positive were determined by image analysis. Values are means ± SD (n = 5-6 in each group). aP < 0.05 vs sham-operated groups, CP < 0.05 vs bile duct-ligated group receiving saline.
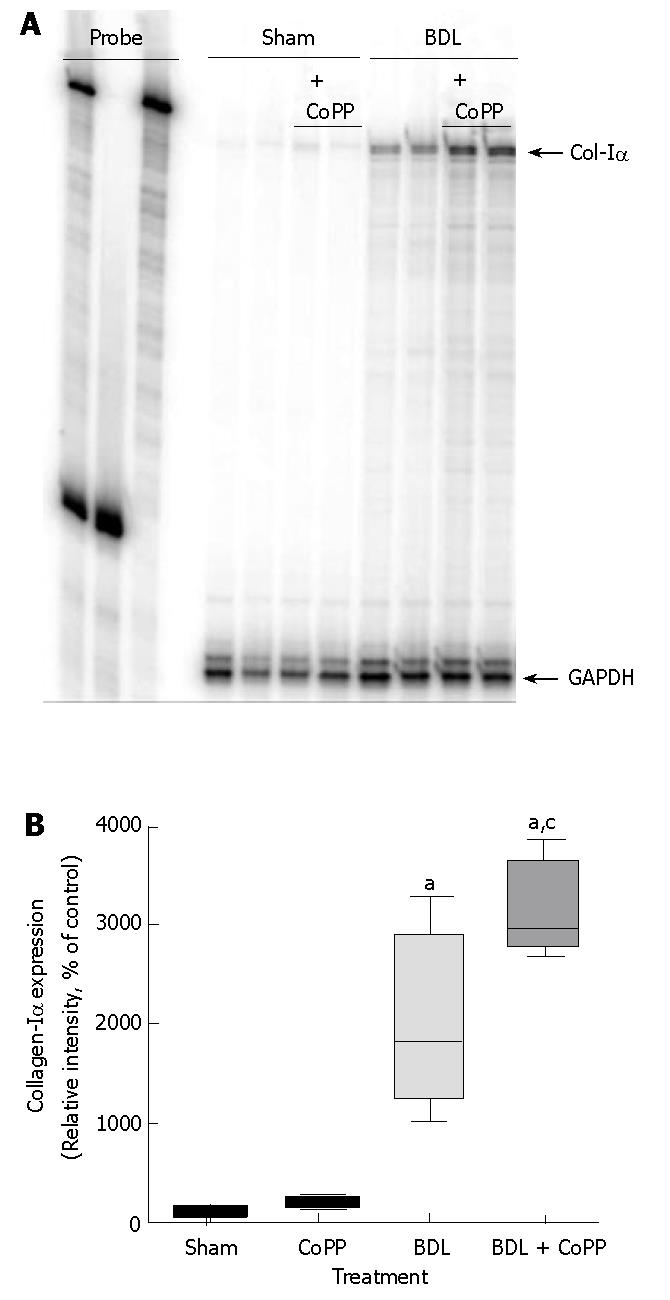
Figure 7 Effects of cholestasis and HO-1 overexpression on collagen-Iα mRNA expression.
Livers were harvested 3 wk after BDL, perfused with normal saline, and frozen in liquid nitrogen. RNase protection assays were performed using an individual probe. Values are means ± SD (n = 4 in each group). Specific bands were quantitated by scanning densitometry and normalized to the signal of GAPDH. A: representative autoradiogram of collagen-Iα mRNA expression; B: densitometric analysis of collagen-Iα mRNA expression. aP < 0.05 vs sham-operated groups, CP < 0.05 vs bile duct-ligated group receiving saline.
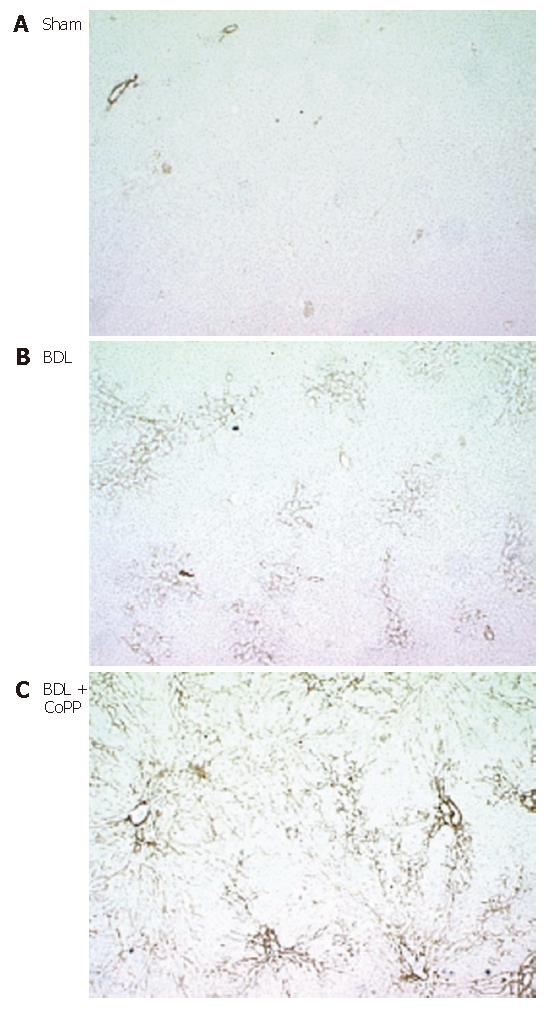
Figure 8 Effects of HO-1 overexpression on α-smooth muscle actin (α-SMA) formation after BDL.
Livers were harvested 3 wk after BDL, and sections were stained immunohistochemically to assess α-SMA. Shown are representative images (x 40). A: sham operation with saline pretreatment; B: BDL with saline pretreatment; C: BDL with CoPP pretreatment.
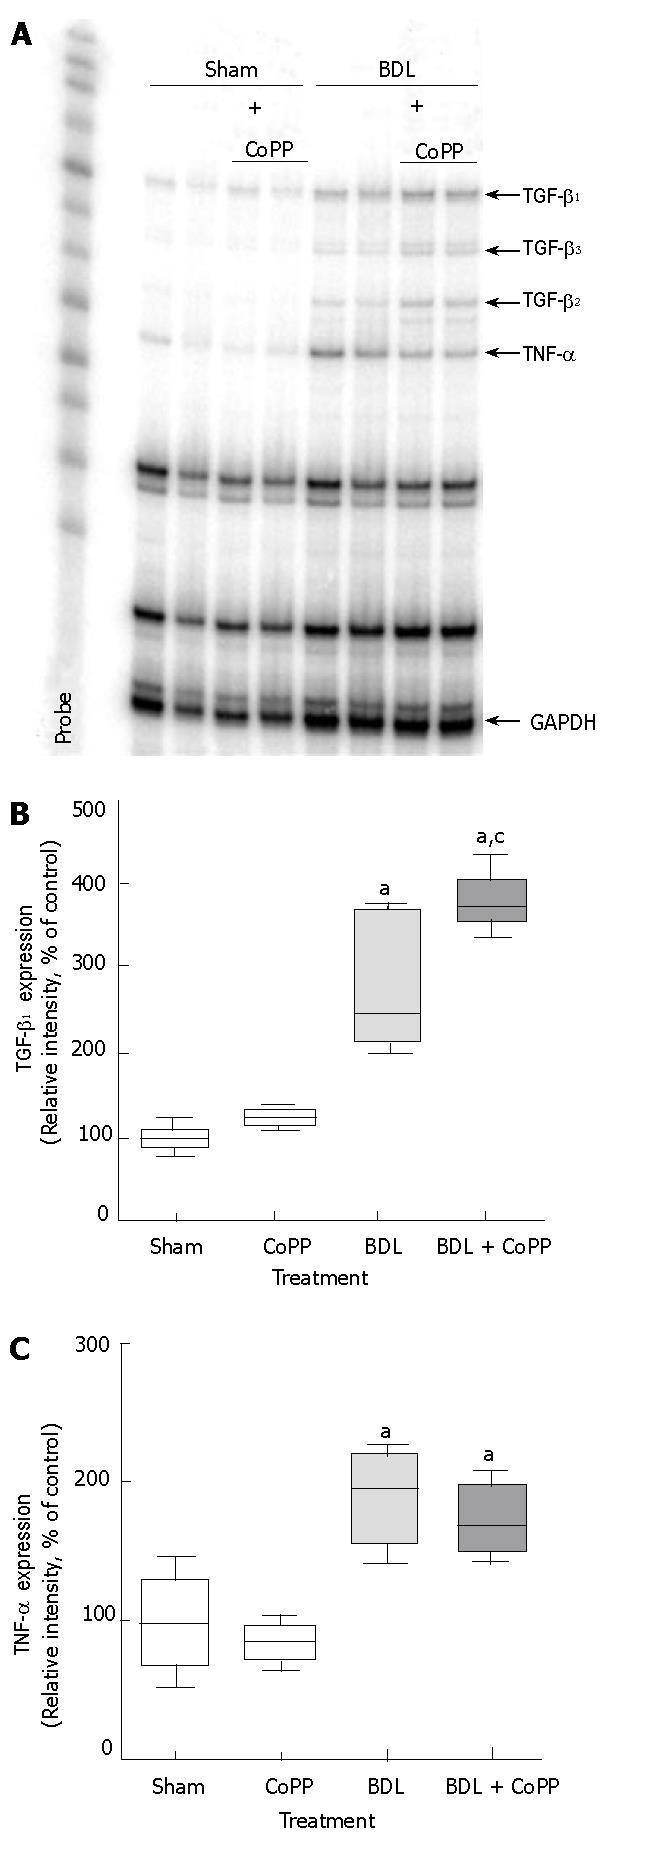
Figure 9 Effects of cholestasis and HO-1 overexpression on production of TGF-β and TNFα.
Livers were harvested 3 wk after bile duct ligation and snap-frozen in liquid nitrogen. TGF-β and TNFα mRNAs were assessed by RNase protection assay using cytokine template sets, as described in MATERIAL AND METHODS. Values are means ± SD (n = 4 in each group). Specific bands were quantitated by scanning densitometry and normalized to the signal of GAPDH. A: representative autoradiogram of TGF-β and TNFα mRNA expression; B: densitometric analysis of TGF-β1 mRNA expression. aP < 0.05 vs sham-operated groups, bP < 0.05 vs bile duct-ligated group receiving saline; C: densitometric analysis of TNFα mRNA expression. aP < 0.05 vs sham-operated groups.
- Citation: Froh M, Conzelmann L, Walbrun P, Netter S, Wiest R, Wheeler MD, Lehnert M, Uesugi T, Scholmerich J, Thurman RG. Heme oxygenase-1 overexpression increases liver injury after bile duct ligation in rats. World J Gastroenterol 2007; 13(25): 3478-3486
- URL: https://www.wjgnet.com/1007-9327/full/v13/i25/3478.htm
- DOI: https://dx.doi.org/10.3748/wjg.v13.i25.3478


