
















©2007 Baishideng Publishing Group Inc.
World J Gastroenterol. Jul 7, 2007; 13(25): 3478-3486
Published online Jul 7, 2007. doi: 10.3748/wjg.v13.i25.3478
Published online Jul 7, 2007. doi: 10.3748/wjg.v13.i25.3478
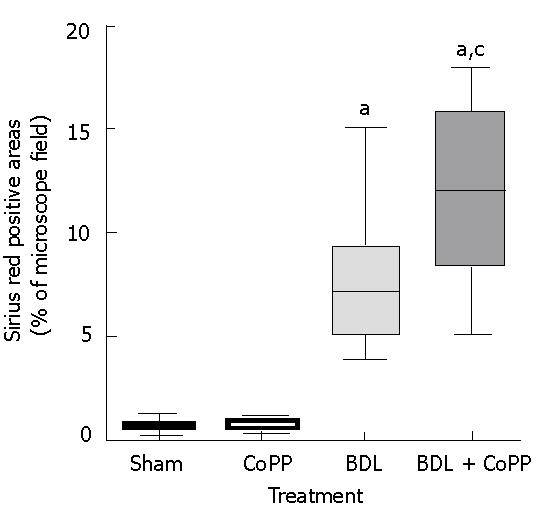
Figure 6 Quantification of hepatic fibrosis after BDL.
Liver sections were stained with Sirius red, as described in Figure 4. Five microscope fields (x 40 objective) were selected randomly, and fractional areas that were Sirius red positive were determined by image analysis. Values are means ± SD (n = 5-6 in each group). aP < 0.05 vs sham-operated groups, CP < 0.05 vs bile duct-ligated group receiving saline.
- Citation: Froh M, Conzelmann L, Walbrun P, Netter S, Wiest R, Wheeler MD, Lehnert M, Uesugi T, Scholmerich J, Thurman RG. Heme oxygenase-1 overexpression increases liver injury after bile duct ligation in rats. World J Gastroenterol 2007; 13(25): 3478-3486
- URL: https://www.wjgnet.com/1007-9327/full/v13/i25/3478.htm
- DOI: https://dx.doi.org/10.3748/wjg.v13.i25.3478