Copyright
©2007 Baishideng Publishing Group Inc.
World J Gastroenterol. Jul 7, 2007; 13(25): 3472-3477
Published online Jul 7, 2007. doi: 10.3748/wjg.v13.i25.3472
Published online Jul 7, 2007. doi: 10.3748/wjg.v13.i25.3472
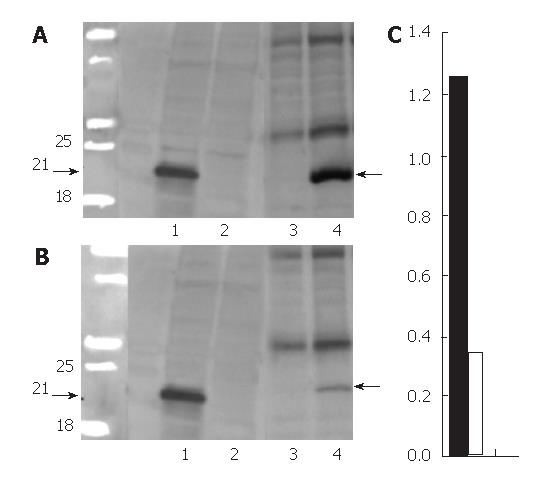
Figure 1 Western blotting for protein extracted from transfected HeLa cells and representative transgenic mice liver.
A: two months old mice; B: the faint 21-KD-core band (line 4) in six months old mice. Lanes 1 and 2: proteins from transfected HeLa cells without and with the administration of doxycycline which served as positive and negative controls. Lanes 3 and 4: proteins from the transgenic mice fed with and without doxycycline chow, respectively; C: The quantitative comparison of the blotting. Black bar, female 2 mo old DTM liver protein (1.26 ± 0.08); white bar: female 6 mo old DTM liver protein (0.34 ± 0.05), P = 0.002 between black and white bars (mean ± SD, n = 3).
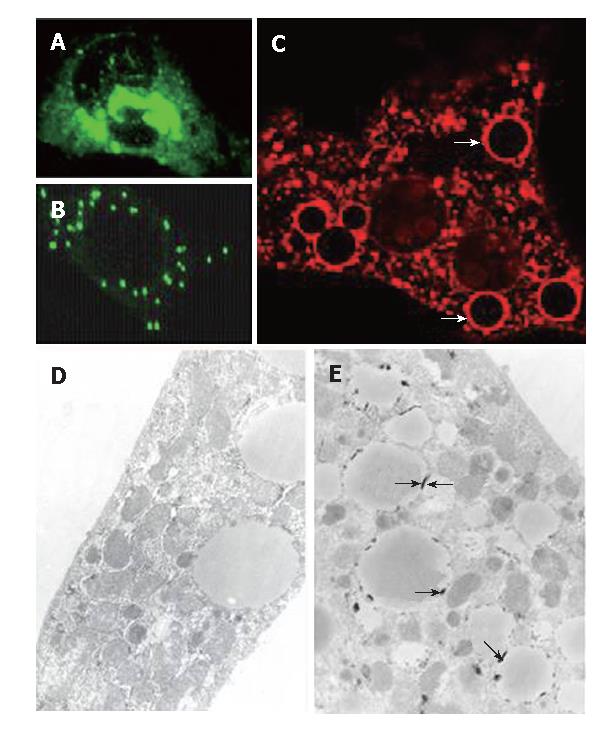
Figure 2 A and B: Immunofluorescent stain for transfected HeLa cells and primary hepatocytes (C) (× 60).
Two cytoplasmic distribution patterns of the core protein in HeLa cells were obtained-condensed perinuclear (A) and disseminated granular (B) patterns. The core protein was present exclusively in the cytoplasm of hepatocytes and some of it exhibited the vesicular pattern (C, × 60, arrows). Under the electron microscope (D and E, × 100), the vesicular structures were found to be lipid vesicles and the core protein was located just underneath the surface of the vesicles (E, arrows), whereas the cells transfected with empty plasmid (PUGH16-3) showed no core associated with the lipid vesicles (D).
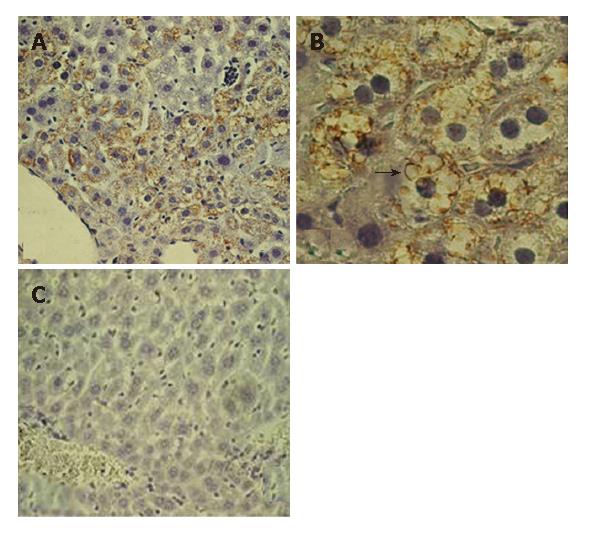
Figure 3 Immunostaining of the female 2 mo old DTM liver (without Dox).
A: The core positive hepatocytes are grouped near a central vein (× 20); B: The characteristic globular core expression is shown clearly (arrow, × 60); C: The sex-age matched DTM on Dox chow mouse liver served as negative control.
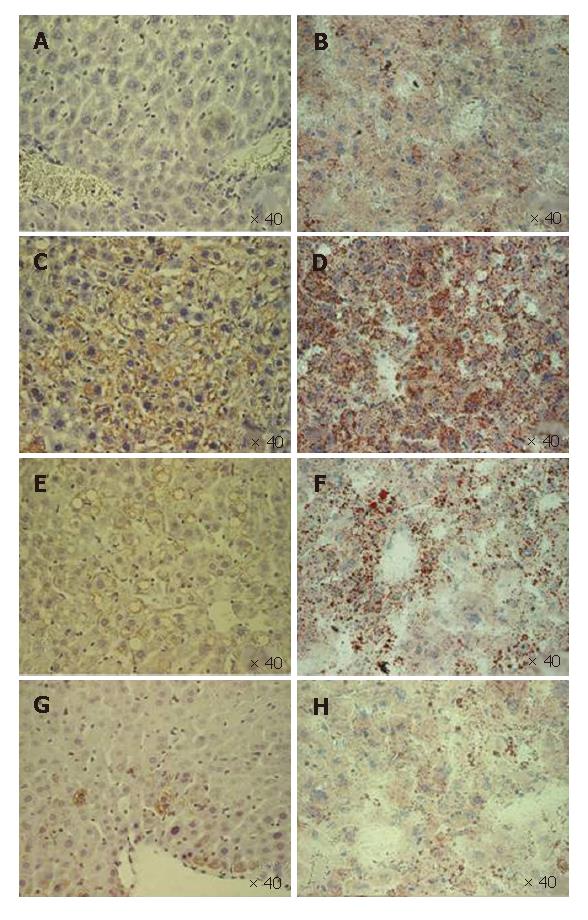
Figure 4 Immunostaining for core protein in core-expressing mice (DTM) livers fixed in 4% PFA (A, C, E and G) and the corresponding oil-red-O stain for fat in the livers of the frozen section (B, D, F and H).
The livers were from the mice on doxycycline (A and B) and those not on doxycycline (C and D) at an age of 2 mo, 4 mo (E and F) and 6 mo (G and H). The core expression parallels the degree of hepatic steatosis. Both peaked at the age of 2 mo (C and D) when the hepatic steatosis was microvesicular (D), and diminished gradually (E and H). Macrovesicular hepatic steatosis (E and F) replaced microvesicluar steatosis during evolution.
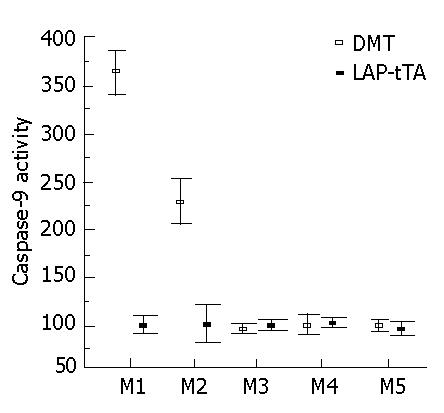
Figure 5 Caspase-9 activity after release of DTM from dox suppression.
Caspase-9 activity is significantly increased in DTM mice at 4 and 8 wk after release from dox suppression (mean ± SE).
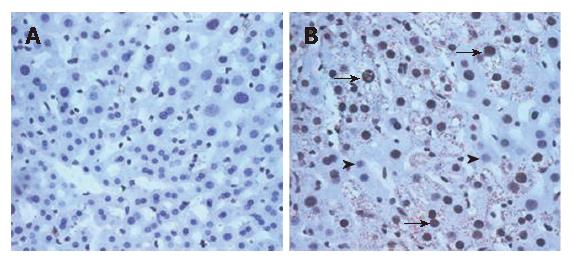
Figure 6 Double stains for core and 8-OHdG at an age of 2 mo for LAP-tTA transgenics (A) and DTM (B).
The density of 8-OHdG was significantly higher in the DTM (B, representatively dark nuclei, arrows, 65% ± 2.4%) than in the LAP-tTA transgenics (2% ± 0.1%). Most 8-OHdG positive cells exhibited robust expression of HCV core. The 8-OHdG negative nuclei were indicated by arrow heads (B).
-
Citation: Chang ML, Chen JC, Yeh CT, Sheen IS, Tai DI, Chang MY, Chiu CT, Lin DY, Bissell DM. Topological and evolutional relationships between HCV core protein and hepatic lipid vesicles: Studies
in vitro and in conditionally transgenic mice. World J Gastroenterol 2007; 13(25): 3472-3477 - URL: https://www.wjgnet.com/1007-9327/full/v13/i25/3472.htm
- DOI: https://dx.doi.org/10.3748/wjg.v13.i25.3472


