Copyright
©2007 Baishideng Publishing Group Co.
World J Gastroenterol. Jun 28, 2007; 13(24): 3333-3341
Published online Jun 28, 2007. doi: 10.3748/wjg.v13.i24.3333
Published online Jun 28, 2007. doi: 10.3748/wjg.v13.i24.3333
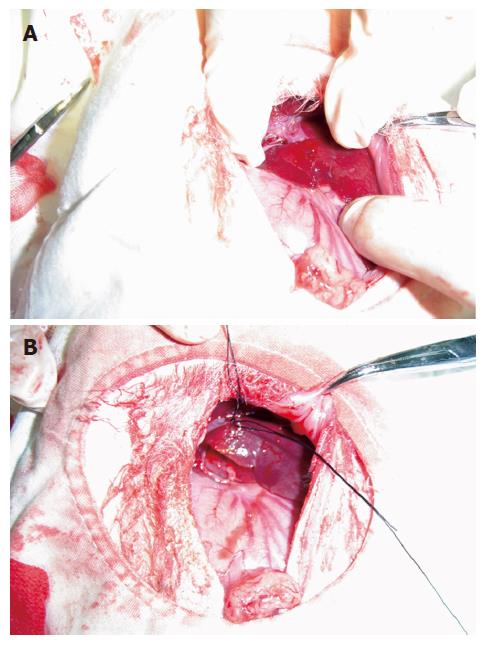
Figure 1 A: The left exite and left endite branch of portal vein were separated naturally in the immediate group; B: Eye forceps was used to cut hepatic tissue near the thick part of left exite after the ligature of left exite branch of portal vein.
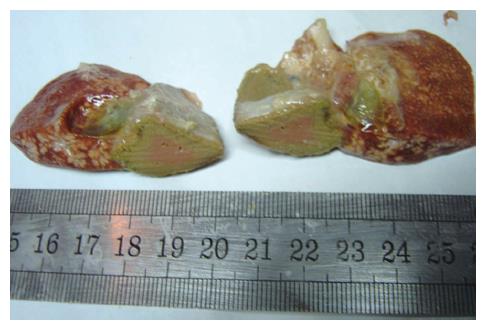
Figure 2 Tumor did not grow in the immediate group after 3 wk.
Volume of left exite was decreased, nature quality was hard and color was deep.
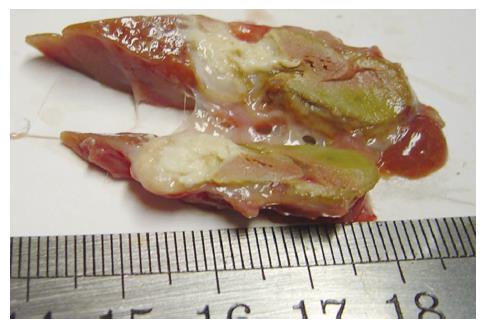
Figure 3 Necrosis of tumor tissue with liquefaction was shown in group B after 2 wk.
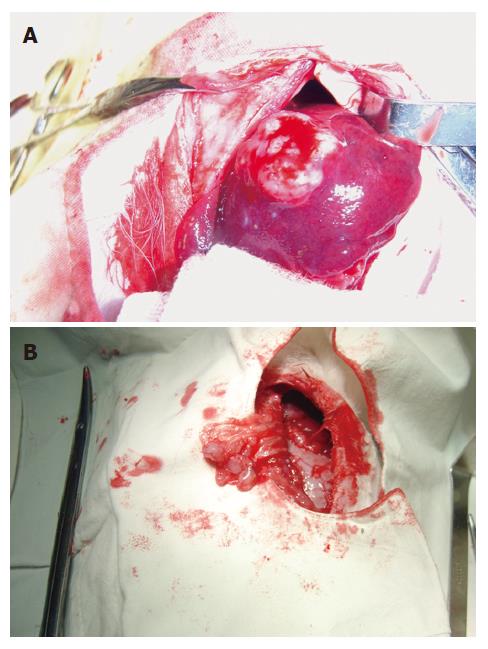
Figure 4 A: Tumor of positive control group was hoar, hard and expansively grown; B: The metastasis of mesentery was shown as swollen lymph node in the same rabbit of Figure 4A.
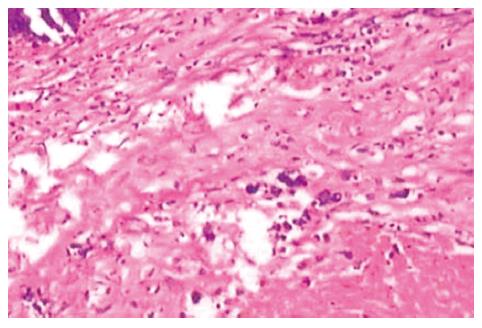
Figure 5 The liver tissue of the left external lobe underwent coagulation necrosis, and was stained homogenously red with hematoxylin-eosin stain in group A (HE, × 100).
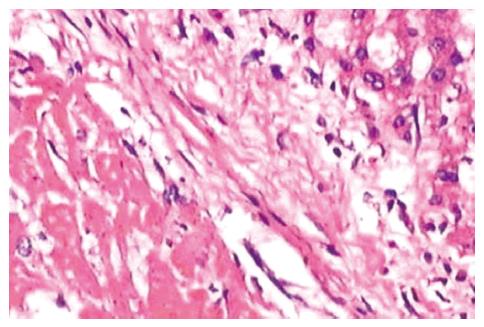
Figure 6 The histologic appearance of the necrosis of tumor tissue included marked proliferation of collagen fibers in group B (HE, × 100).
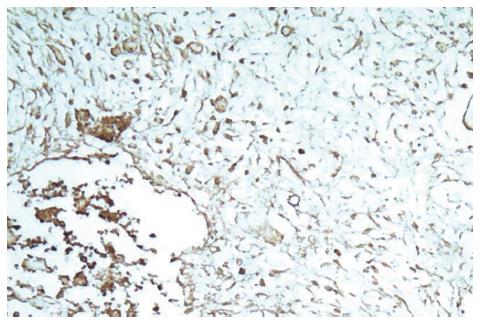
Figure 7 The average optical density (AOD) of VEGF in group A was 0.
09 ± 0.08 (SP, × 100).
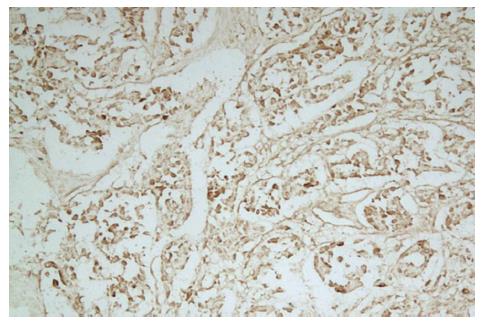
Figure 8 The AOD of the VEGF in group B was 0.
72 ± 0.28 (SP, × 100).
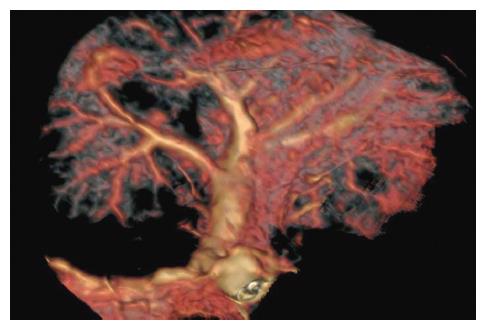
Figure 9 The volume rendering image of MSCTA shows of the normal portal vein.
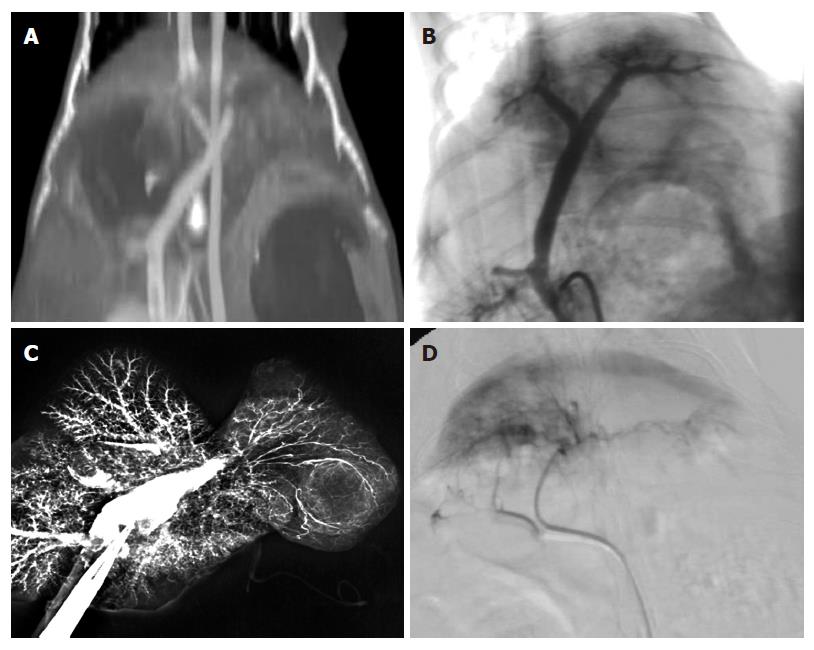
Figure 10 A: The multiplanar reformation image shows the ligature of the left external branch of portal vein; B: The DSA of the portal vein shows the ligature of the left external branch of portal vein; C: The vascular perfusion of both hepatic artery and portal vein shows the blood supply of the left external tumor from left hepatic artery; D: DSA of hepatic artery shows the blood supply of the left external tumor from left hepatic artery.
Figure 11 A: MSCT scanning shows that hepatic tissue and tumor wall of left exite were shrunk in group of portal vein occlusion at 3 wk after tumor transplantation; B: The TDC of hepatic tumor of the left external lobe in the same rabbit of Figure 4A; C: The blood flow image in the same rabbit of Figure 11A.
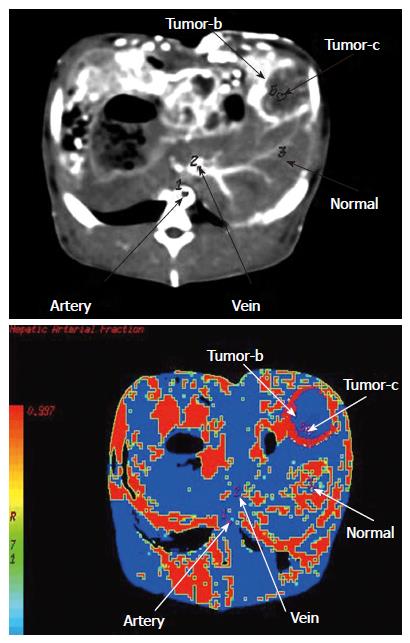
Figure 12 A: MSCT scanning shows the hepatic VX2 tumor of the left external lobe in a rabbit of positive control group; B: HAF image in the same rabbit of Figure 12A.
- Citation: Qi YY, Zou LG, Liang P, Zhang D. Establishing models of portal vein occlusion and evaluating value of multi-slice CT in hepatic VX2 tumor in rabbits. World J Gastroenterol 2007; 13(24): 3333-3341
- URL: https://www.wjgnet.com/1007-9327/full/v13/i24/3333.htm
- DOI: https://dx.doi.org/10.3748/wjg.v13.i24.3333


