Copyright
©2007 Baishideng Publishing Group Co.
World J Gastroenterol. Jun 14, 2007; 13(22): 3063-3070
Published online Jun 14, 2007. doi: 10.3748/wjg.v13.i22.3063
Published online Jun 14, 2007. doi: 10.3748/wjg.v13.i22.3063
Math 1 Math(A1).
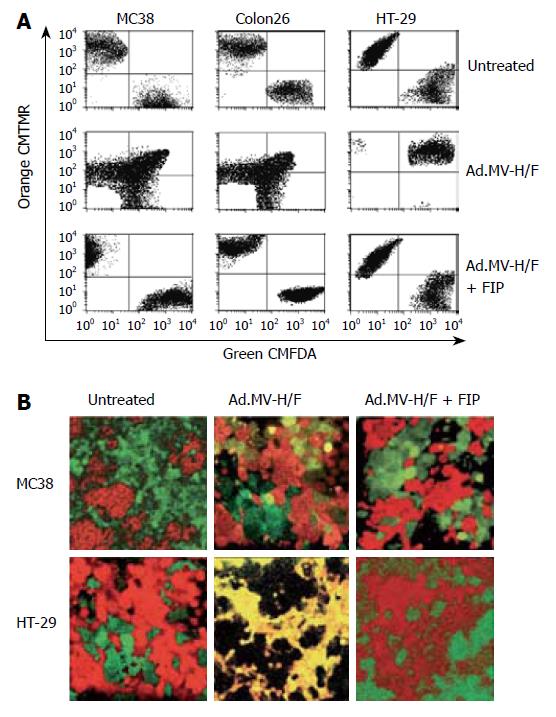
Figure 1 Quantification of cell-cell fusion by flow cytometry and laser scanning confocal microscopy.
A: Twenty-four hours later cells were analyzed for dye colocalization by flow cytometry. As a control we used the synthetic fusion inhibitory peptide (FIP); B: In addition we analyzed the cells 36 h after transduction with Ad.MV-H/F by confocal laser scanning microscopy. Transduction of Colon26 cells with Ad.MV-H/F resulted in similar cell-cell fusion as in MC38 cells (data not shown). One representative experiment out of three is shown.
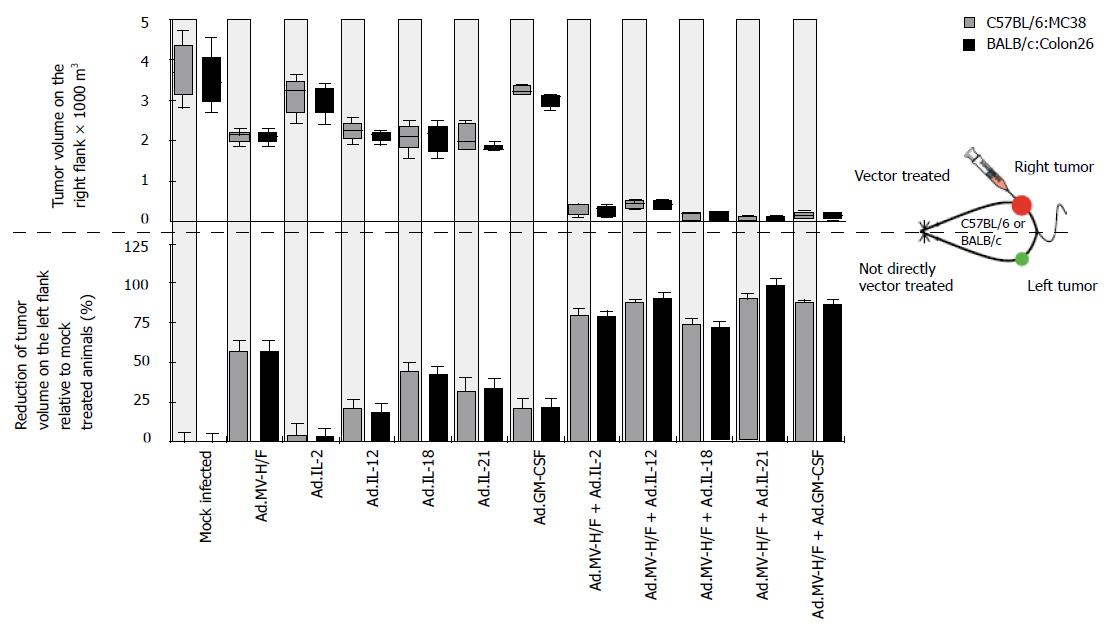
Figure 2 Local and immune-mediated tumor control in a syngeneic bilateral subcutaneous colon cancer model.
A: The volume of the tumor on the right flank was measured at d 28 and presented as box-and-whisker plots, showing minimum, 25th percentile, median, 75th percentile, and maximum tumor volume; B: The volume of the tumor on the left flank, which did not receive direct viral vector injections, was measured at d 28 and the volume reduction relative to mock treated animals is presented as bar graphs (mean ± SD). Data of C57BL/6 are presented in white and the data of BALB/c are presented in orange.
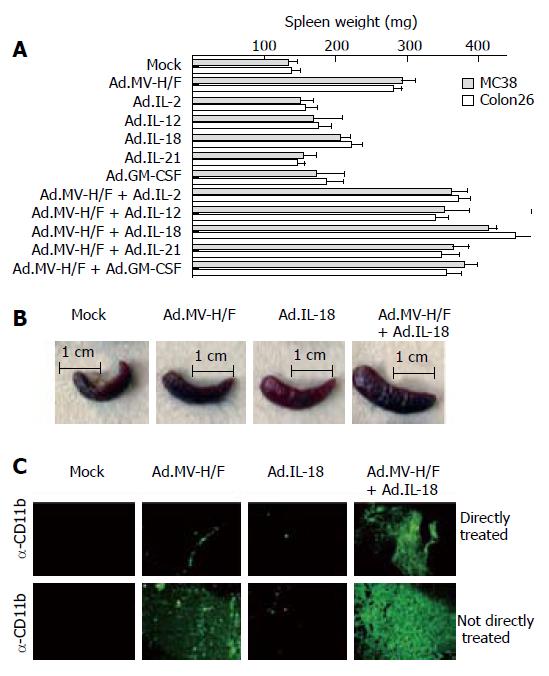
Figure 3 Effect of indicated treatments on the spleen weight and infiltration of tumors with macrophages.
Treatment was carried out as described in Figure 2. A: At d 29 animals were euthanized and spleen weight was determined (mean ± SD); B: The spleens of representative mice of different treatment groups are shown; C: In addition, fourteen days after initiation of therapy continous serial sections of the directly and not directly vector treated tumors of spare animals were prepared and individually immunostained for indicated cells. Representative slides are shown; original magnification × 400. Similar data were obtained in the Colon26 tumor model (data not shown).
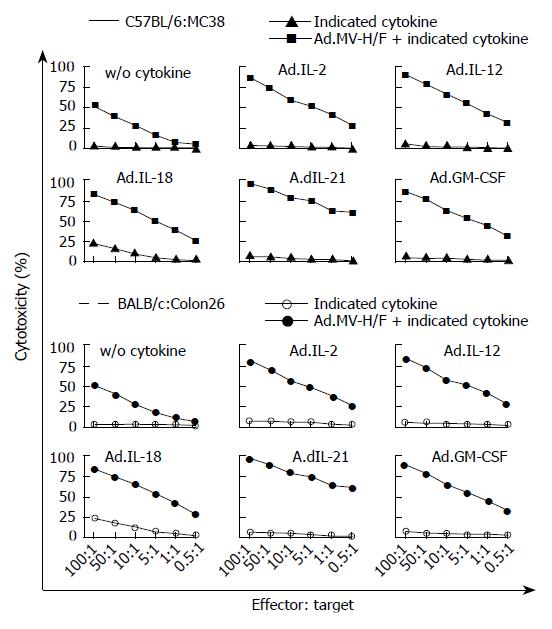
Figure 4 T cell mediated tumor regression by expression of MV-FMG alone or in combination with cytokines.
Data of all animals were expressed as the percentage of specific release of three independent experiments (mean ± SD).
-
Citation: Hoffmann D, Bayer W, Wildner O.
In situ tumor vaccination with adenovirus vectors encoding measles virus fusogenic membrane proteins and cytokines. World J Gastroenterol 2007; 13(22): 3063-3070 - URL: https://www.wjgnet.com/1007-9327/full/v13/i22/3063.htm
- DOI: https://dx.doi.org/10.3748/wjg.v13.i22.3063


