Copyright
©2007 Baishideng Publishing Group Co.
World J Gastroenterol. Jun 7, 2007; 13(21): 2999-3002
Published online Jun 7, 2007. doi: 10.3748/wjg.v13.i21.2999
Published online Jun 7, 2007. doi: 10.3748/wjg.v13.i21.2999
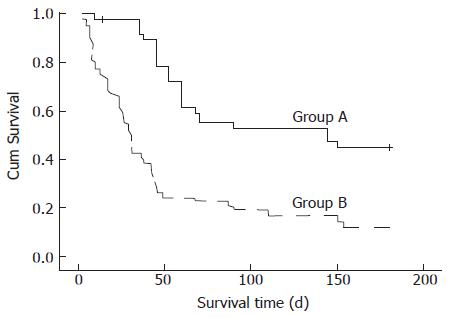
Figure 1 Kaplan-Meier survival curves for group A (at low risk, SMSVH scores ≤ 4) and group B (at high risk, SMSVH scores ≥ 5).
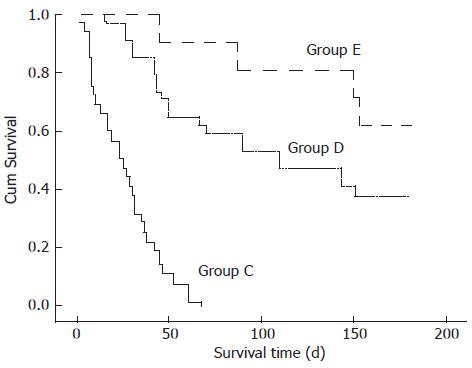
Figure 2 Kaplan-Meier survival curves for group C (SMSVH score unchanged or increased) and group D (SMSVH score decrease by 1) and group E (SMSVH score decreased by 2 or more) after 2 wk of medical therapy.
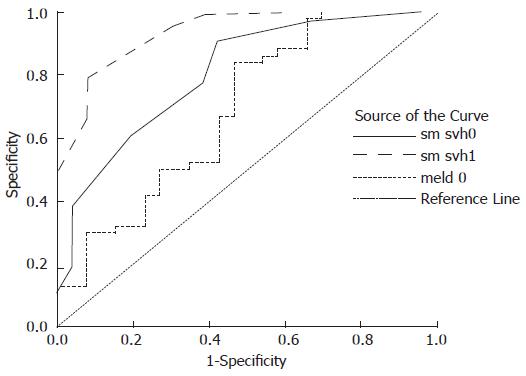
Figure 3 ROC curves for the 6-mo survival rate estimated with MELD and SMSVH at baseline (SMSVH0) and after 2 wk of medical therapy (SMSVH1).
- Citation: Zhou L, Dong PL, Ding HG. Comparison scoring model of severe viral hepatitis and model of end stage liver disease for the prognosis of patients with liver failure in China. World J Gastroenterol 2007; 13(21): 2999-3002
- URL: https://www.wjgnet.com/1007-9327/full/v13/i21/2999.htm
- DOI: https://dx.doi.org/10.3748/wjg.v13.i21.2999


