Copyright
©2007 Baishideng Publishing Group Co.
World J Gastroenterol. Jun 7, 2007; 13(21): 2960-2966
Published online Jun 7, 2007. doi: 10.3748/wjg.v13.i21.2960
Published online Jun 7, 2007. doi: 10.3748/wjg.v13.i21.2960
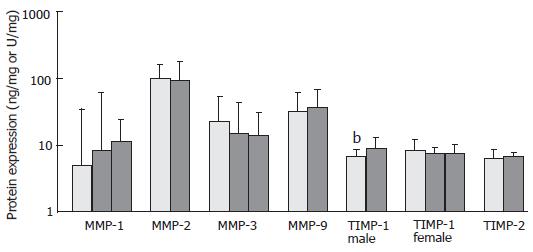
Figure 1 Protein expression in inflamed IBD tissue stratified to genotype.
Values represent the median + 75th percentile and are in ng/mg (MMP-2, -9, TIMP-1, -2) or in arbitrary units/mg (MMP-1, -3). From left to right; MMP-1: 1G1G, 1G2G, 2G2G (n = 6, 17, 5); MMP-2: CC, CT + TT (n = 99, 77); MMP-3: 5T5T, 5T6T, 6T6T (n = 21, 33, 16); MMP-9: CC, CT + TT (n = 129, 46); TIMP-1 male: T, C (n = 47, 24); TIMP-1 female: TT, TC, CC (n = 42, 37, 26); TIMP-2: GG, GA + AA (n = 135, 41). bP < 0.01, Mann-Whitney U test.
- Citation: Meijer MJ, Mieremet-Ooms MA, Hogezand RAV, Lamers CB, Hommes DW, Verspaget HW. Role of matrix metalloproteinase, tissue inhibitor of metalloproteinase and tumor necrosis factor-α single nucleotide gene polymorphisms in inflammatory bowel disease. World J Gastroenterol 2007; 13(21): 2960-2966
- URL: https://www.wjgnet.com/1007-9327/full/v13/i21/2960.htm
- DOI: https://dx.doi.org/10.3748/wjg.v13.i21.2960


