Copyright
©2007 Baishideng Publishing Group Co.
World J Gastroenterol. May 28, 2007; 13(20): 2883-2888
Published online May 28, 2007. doi: 10.3748/wjg.v13.i20.2883
Published online May 28, 2007. doi: 10.3748/wjg.v13.i20.2883
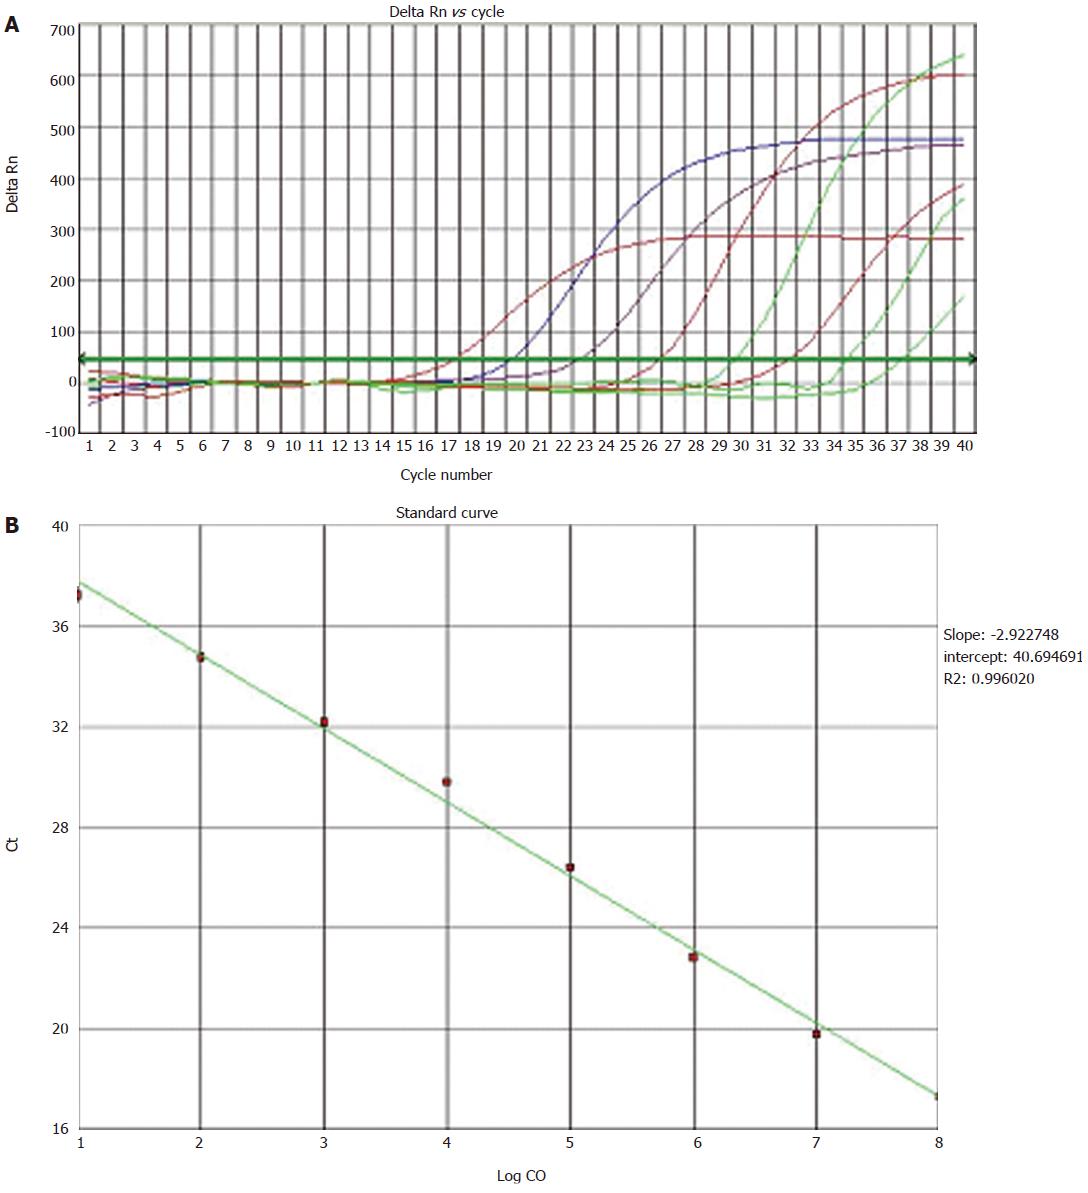
Figure 1 Sensitivity and dynamic range of let-7a miRNA assay.
A: Amplification curve of the synthesized let-7a miRNA, the well-behaved assay exhibited high sensitivity and broad dynamic range between the signal of 10 copies and 108 copies input template and the no-template-control background; B: Standard curve of the let-7a miRNA (r2 = 0.996, slope = -2.92).
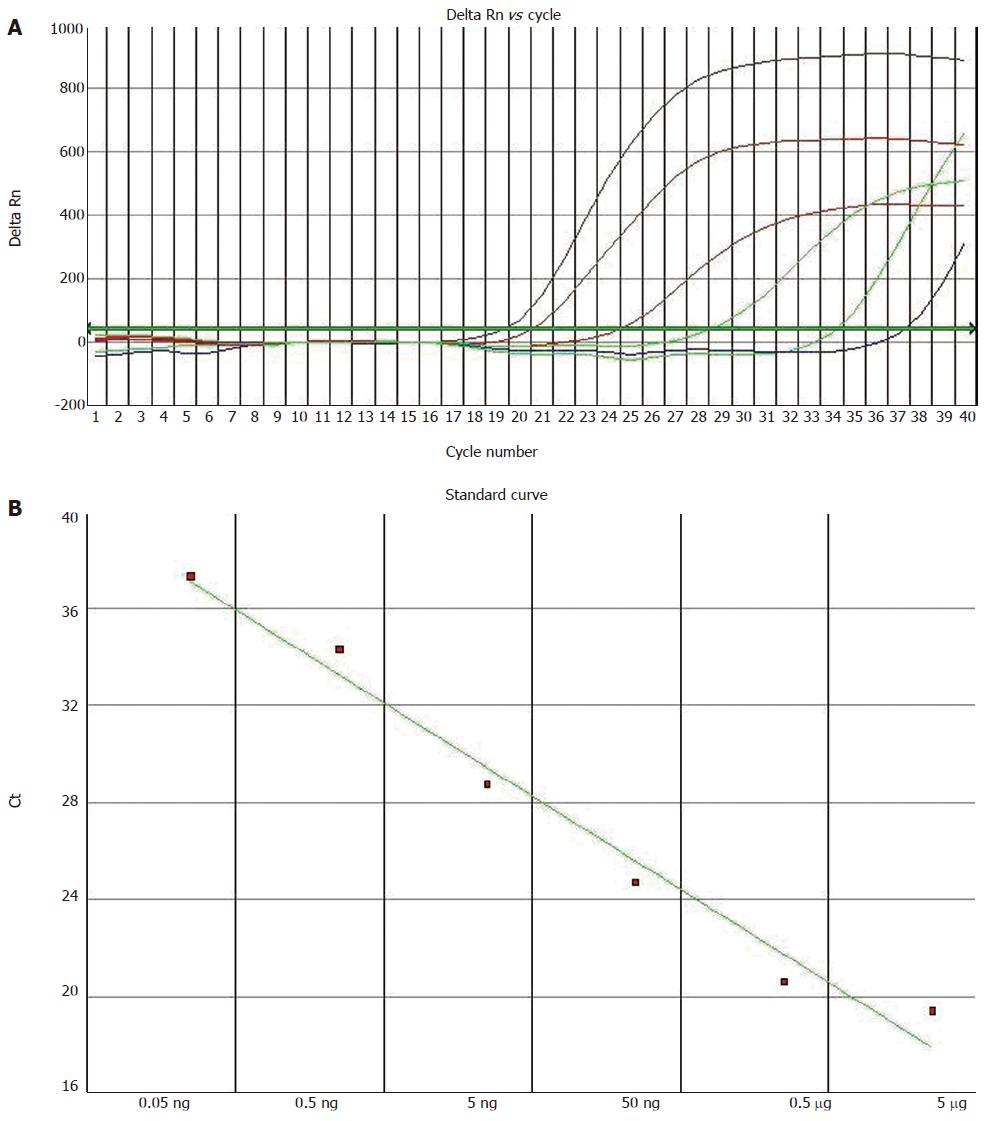
Figure 2 Total RNA sensitivity and dynamic range of let-7a miRNA assay.
A: Amplification plot of total RNA from gastric mucosa at six orders of magnitude. The total RNA input ranged from 50 pg to 5 μg in per stem-loop RT-PCR reaction; B: Correlation of total RNA input with the threshold of cycle (Ct) values for let-7a miRNA assays.
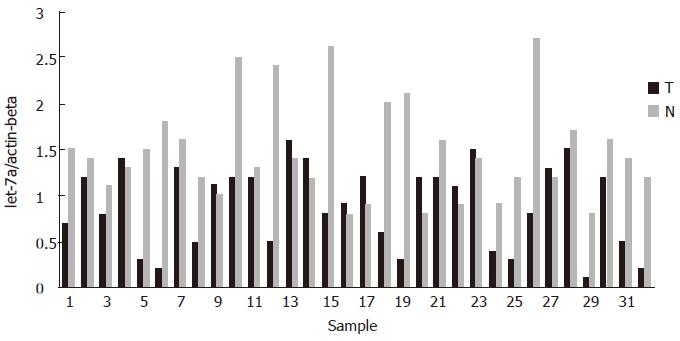
Figure 3 Expression of let-7a miRNA in gastric cancer.
Difference in let-7a miRNA expression between in tumor tissues (T) and the adjacent non-tumor tissues (N). The patient numbers correspond to those in Table 2. Compared to normal tissues, let-7a miRNAs expression in tumor tissue from 14 patients was significantly down-regulated.
- Citation: Zhang HH, Wang XJ, Li GX, Yang E, Yang NM. Detection of let-7a microRNA by real-time PCR in gastric carcinoma. World J Gastroenterol 2007; 13(20): 2883-2888
- URL: https://www.wjgnet.com/1007-9327/full/v13/i20/2883.htm
- DOI: https://dx.doi.org/10.3748/wjg.v13.i20.2883


